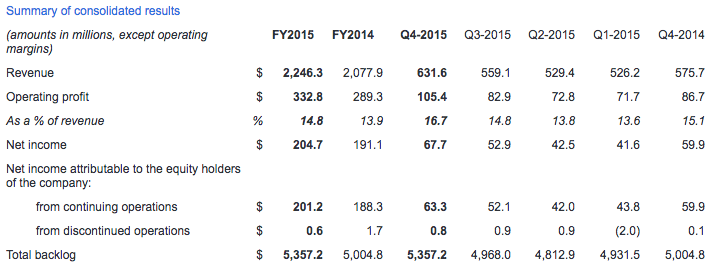
Record quarterly and annual revenue of $631.6 million and $2.2 billion
Q4 and annual EPS from continuing operations of $0.24 and $0.76
Q4 operating profit (1) up 22% and annual operating profit up 15% over comparable periods
Record $5.4 billion consolidated backlog (2)
Operationalized outsourcing with Japan Airlines, in line with 'training partner of choice' vision
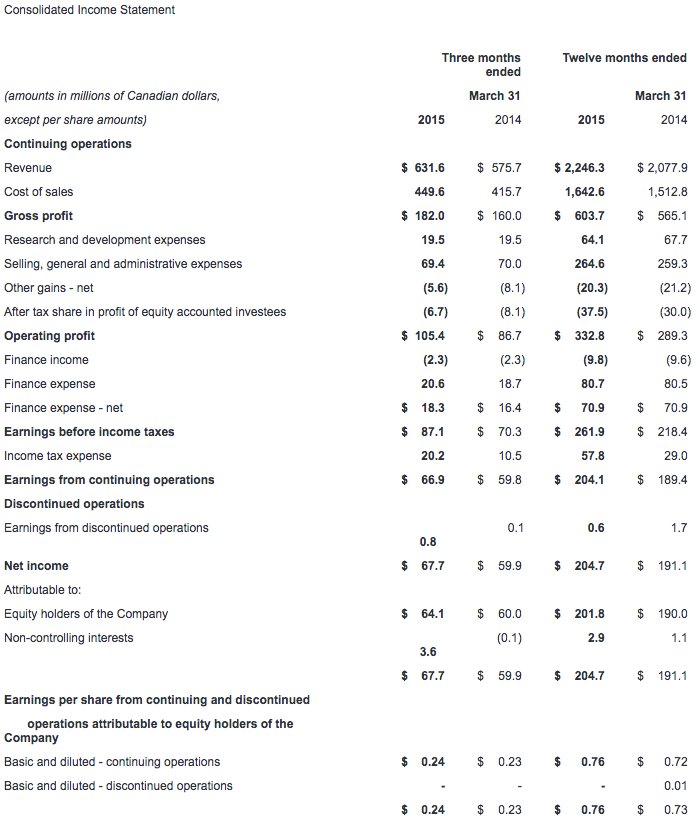
CAE today reported revenue of $631.6 million for the fourth quarter of fiscal year 2015, representing a 10% increase from the fourth quarter last year. Operating profit for the quarter was up 22% to $105.4 million and operating margin expanded 160 basis points to 16.7% from the fourth quarter last year. The effective tax rate for the quarter was 23% compared to 15% last year. Fourth quarter net income attributable to equity holders from continuing operations was $63.3 million ($0.24 per share), up 6% from the same period last year.
Full year fiscal 2015 revenue was $2.2 billion, an increase of 8% from fiscal year 2014. Annual operating profit increased 15% to $332.8 million, resulting in an operating profit margin expansion of 90 basis points to 14.8% from fiscal year 2014. The effective tax rate for the year was 22% compared to 13% in the prior year. Fiscal year 2015 net income attributable to equity holders from continuing operations was $201.2 million ($0.76 per share), up 7% compared to last year. All financial information is in Canadian dollars.
"I'm pleased with fourth quarter and fiscal year performance overall, having met most of our strategic and financial milestones," said Marc Parent, CAE's President and Chief Executive Officer. "We generated record revenues with higher operating profits, and reached a new record backlog. Our Civil business achieved double-digit revenue growth and a higher operating margin for the year, notwithstanding a slower ramp up in training centre utilization than we anticipated in the last quarter. In Defence, we achieved top and bottom line growth in a down defence market, and we reached a book-to-sales(3) ratio above one time in the fourth quarter. In Healthcare, we demonstrated strong revenue and operating income growth, reaffirming our conviction in this market. For the year, higher cash flow from operations and lower capital expenditures(4) enabled us to further strengthen our balance sheet. We look forward to more success in fiscal year 2016 and we are encouraged by the long term growth potential for CAE with its industry leading training solutions."
Civil Aviation Training Solutions (Civil)
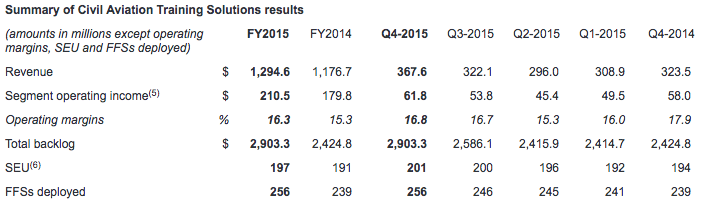
Fourth quarter Civil revenue was $367.6 million, up 14% compared to the prior year period. Fourth quarter operating income was $61.8 million (16.8% of revenue), up 7% compared to last year.
Annual revenue was $1,294.6 million, up 10% compared to the prior year. Annual operating income was $210.5 million (16.3% of revenue), up 17% compared to last year.
During the fiscal year, we entered highly strategic training services agreements including new joint ventures with Japan Airlines and China Eastern Airlines, and the renewal of our training service outsourcing agreement with Iberia.
During the quarter we signed long-term training services agreements with airlines and operators in the Americas, Asia Pacific and Europe, and we received 10 full-flight simulator (FFS) orders from customers including Southwest Airlines, WestJet Encore and China Airlines, bringing the year to date total to 41. We received $398.0 million in Civil orders this quarter for a book-to-sales ratio of 1.08x. Book-to-sales ratio for the year was 1.17x. Fourth quarter Civil backlog was $2.9 billion, including our share of joint ventures.
Defence and Security (Defence)
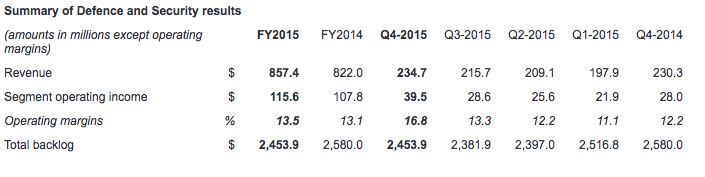
Revenue for Defence in the fourth quarter was $234.7 million, up 2% compared to last year. Fourth quarter operating income was $39.5 million (16.8% of revenue), up 41% compared to $28.0 million (12.2% of revenue) last year.
Annual revenue was $857.4 million, up 4% from the prior year. Annual operating income was $115.6 million (13.5% of revenue), up 7% compared to $107.8 million (13.1% of revenue) last year.
During the fiscal year, we grew our training services portfolio, including the start of T-44C training for the US Navy under an innovative contractor-owned, contractor-operated training program. In addition, the CAE Brunei Multi-Purpose Training Centre, our joint venture with the Government of Brunei, officially opened and is now delivering fixed- and rotary-wing training.
During the quarter, we signed contracts involving enduring platforms and a broad range of geographies, including the provision of a C-130J weapon systems trainer for the US Air Force, M-346 simulators for the Italian Air Force, AW101 helicopter training devices for the Royal Navy, AW139 helicopter simulator for Australia's Toll Group, and P-8A simulators for the Royal Australian Air Force. Defence customers continued to enhance and upgrade legacy training systems as they transition to additional virtual training. We signed numerous upgrade contracts, including a major visual system upgrade on the Royal Canadian Air Force's CH-146 helicopter simulator. We also announced plans to acquire Bombardier's Military Aviation Training business unit, which operates the NATO Flying Training in Canada (NFTC) program for the Royal Canadian Air Force and allies. In total, we received $237.8 million in Defence orders this quarter, representing a book-to-sales ratio of 1.01x. The book-to-sales ratio for the last 12 months was 0.88x. Fourth quarter Defence backlog was $2.5 billion, including joint ventures and unfunded backlog.
Healthcare
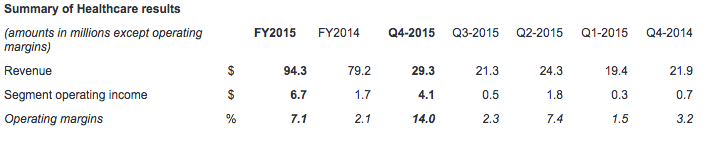
Revenue for Healthcare was $29.3 million in the fourth quarter, up 34% compared to the same quarter last year. Fourth quarter operating income was $4.1 million (14.0% of revenue), up nearly six-fold compared to $0.7 million last year (3.2% of revenue).
Annual revenue was $94.3 million, up 19% over the prior year. Annual operating income was $6.7 million (7.1% of revenue), up nearly four-fold compared to $1.7 million (2.1% of revenue) last year.
During the quarter, we continued to gain traction with our solutions approach, new products, and enhanced global reach. We booked a number of large orders for comprehensive solutions involving our broad portfolio of products and services. We sold a turnkey healthcare simulation training centre for the Turkmenistan Ministry of Health, including the entire range of CAE's patient, interventional, ultrasound and simulation centre management solutions, as well as consulting, training and support services. In the U.S., we sold patient simulators, simulation centre management solutions and curriculum to Southeastern University and a community college. We also sold patient simulators and a range of other products including ultrasound simulators to customers in Southeast Asia, Eastern Europe and Africa. And in the defence sector, we sold patient simulators to the Australian Defence Forces.
Additional financial highlights
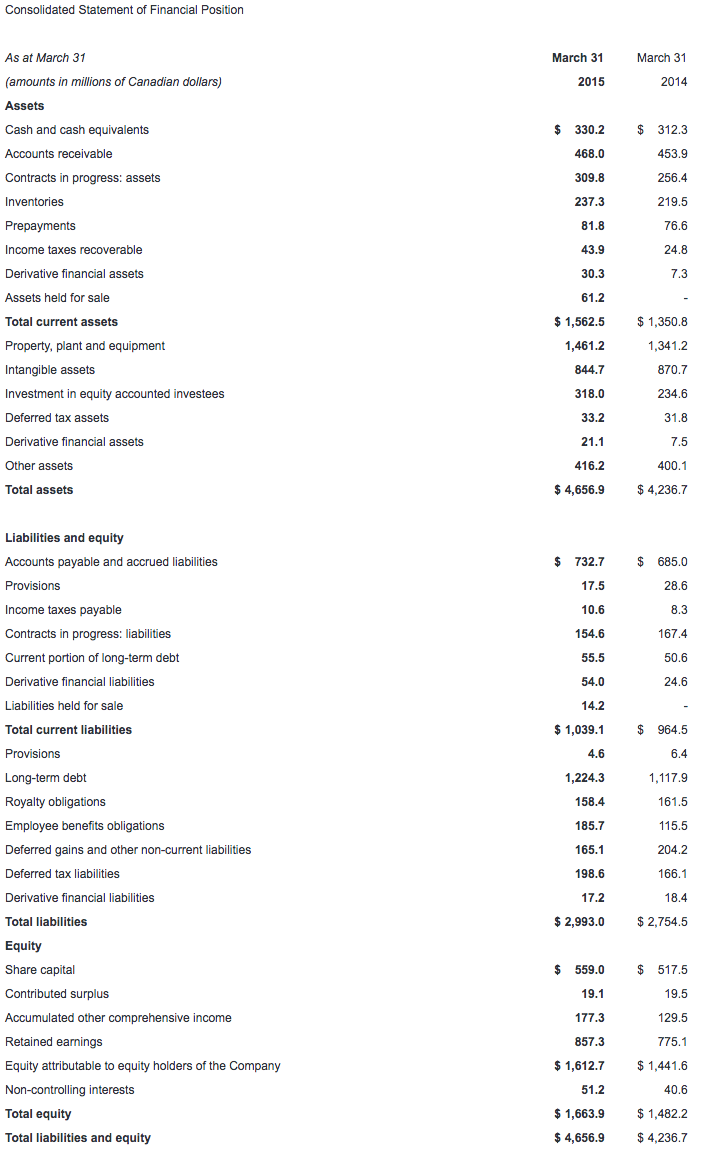
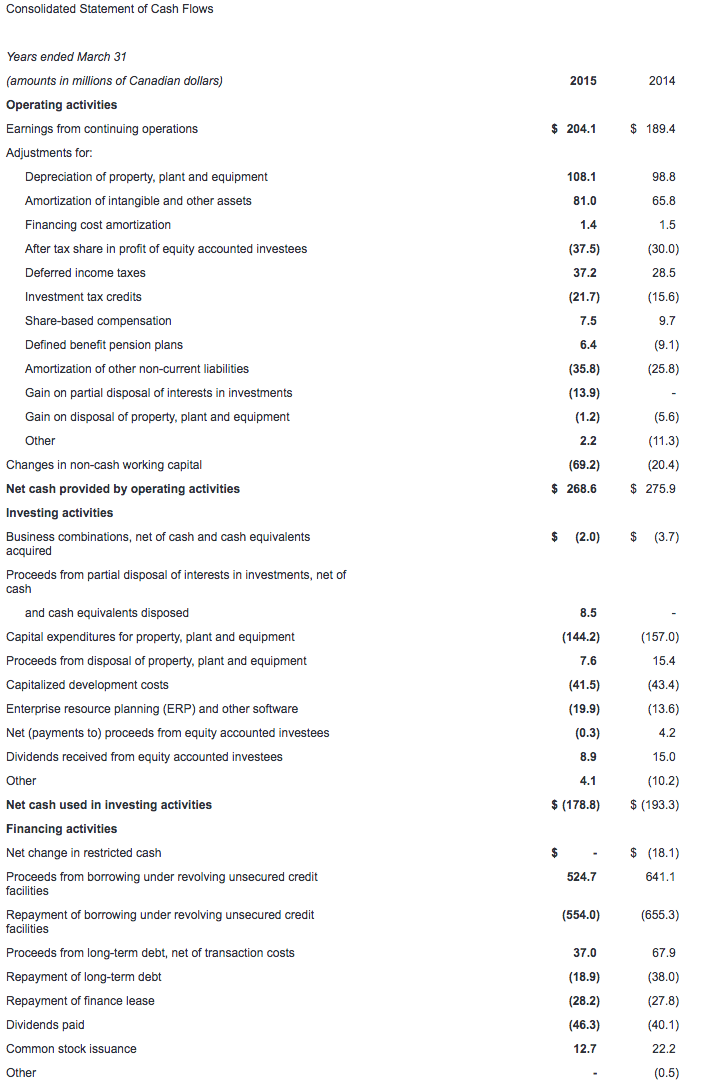
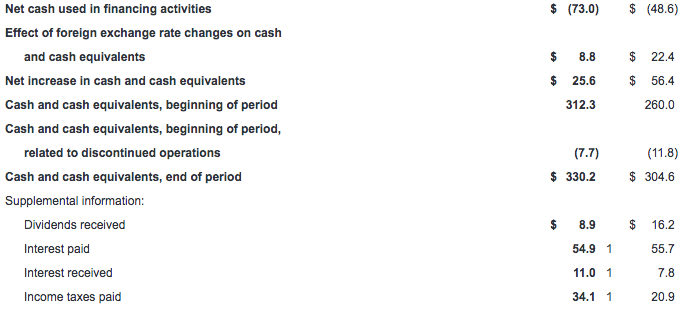
Free cash flow(7) was positive $142.2 million for the fourth quarter up from $108.3 million in the fourth quarter last year. For the year, net cash provided by continuing operating activities was $268.6 million. Net cash provided by continuing operating activities after deducting net cash used in investing activities was $89.8 million, up 9% from the prior year.
Capital expenditures totaled $40.7 million for the quarter and $144.2 million for the year. Growth capital expenditures represented two-thirds of the annual total, and maintenance capital expenditures the remainder. Annual capital expenditures were 8% lower than the $157.0 million the year prior.
Net debt(8) was $949.6 million as at March 31, 2015, compared to $971.7 million as at December 31, 2014 decreasing our net debt-to-total capital(9) ratio to 36.3%.
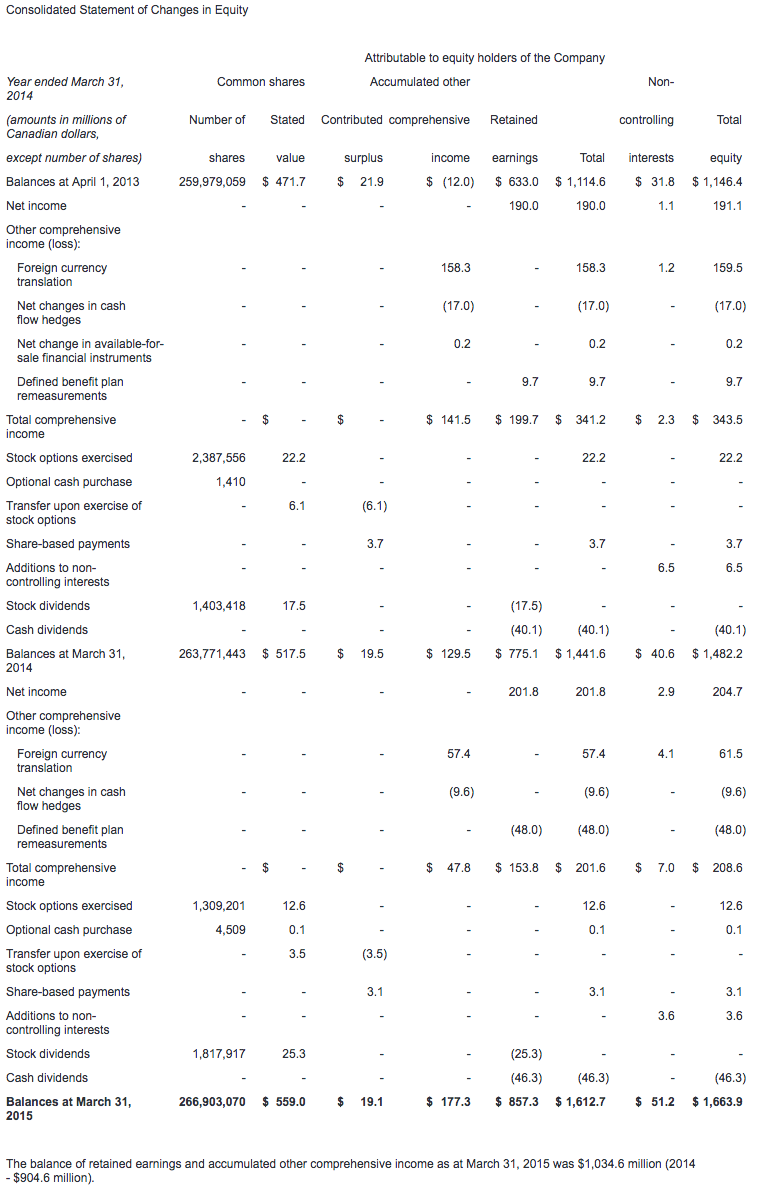
CAE will pay a dividend of $0.07 per share effective June 30, 2015 to shareholders of record at the close of business on June 15, 2015.
Management outlook for fiscal 2016
We expect growth for the year across all business segments, with performance continuing to follow CAE's usual seasonal pattern, involving a stronger second half of the fiscal year than the first. With the majority of investments now complete to develop our global training centre footprint, capital expenditures are expected to be lower again in fiscal 2016 at approximately $100 million. In view of that and our positive long term market outlook, we anticipate higher returns on capital employed(10) going forward as we fill capacity and incrementally invest in customer-driven growth opportunities. In Civil, we expect annual operating margins to continue to improve from the 16.3% level reached last year on higher training utilization(11), and we expect to have FFS unit sales in the range of the fiscal 2015 number. In Defence, we expect continued modest growth with operating margins remaining in the 12-13% range.
Detailed information
Readers are strongly advised to view a more detailed discussion of our results by segment in the Management's Discussion and Analysis (MD&A) and CAE's consolidated financial statements which are posted on our website at www.cae.com/investors.
CAE's consolidated financial statements and management's discussion and analysis for the year ended March 31, 2015 have been filed with the Canadian Securities Administrators on SEDAR (www.sedar.com) and are available on our website (www.cae.com). They have also been filed with the U.S. Securities and Exchange Commission and are available on their website (www.sec.gov).
Conference call Q4 and full-year FY2015
CAE President and CEO, Marc Parent; Stephane Lefebvre, Vice President, Finance, and CFO; and Andrew Arnovitz, Vice President, Strategy and Investor Relations will conduct an earnings conference call today at 1:00 p.m. ET. The call is intended for analysts, institutional investors and the media. Participants can listen to the conference by dialling + 1 877 586 3392 or +1 416 981 9024. The conference call will also be audio webcast live for the public at www.cae.com.
CAE is a global leader in delivery of training for the civil aviation, defence and security, and healthcare markets. We design and integrate the industry's most comprehensive training solutions, anchored by the knowledge and expertise of our 8,000 employees, our world-leading simulation technologies and a track record of service and technology innovation spanning nearly seven decades. Our global presence is the broadest in the industry, with 160 sites and training locations in 35 countries, including our joint venture operations, and the world's largest installed base of flight simulators. Each year, we train more than 120,000 civil and defence crewmembers, as well as thousands of healthcare professionals worldwide.
Caution concerning limitations of summary earnings press release.
This summary earnings press release contains limited information meant to assist the reader in assessing CAE's performance but it is not a suitable source of information for readers who are unfamiliar with CAE and is not in any way a substitute for the company's financial statements, notes to the financial statements, and MD&A reports.
Caution concerning forward-looking statements
Certain statements made in this news release are forward-looking statements. These statements include, without limitation, statements relating to our fiscal 2016 financial guidance (including revenues, capital investment and margins) and other statements that are not historical facts. Forward-looking statements are typically identified by future or conditional verbs such as anticipate, believe, expect, and may. All such forward-looking statements are made pursuant to the 'safe harbour' provisions of applicable Canadian securities laws and of the United States Private Securities Litigation Reform Act of 1995. Forward-looking statements, by their very nature, are subject to inherent risks and uncertainties and are based on several assumptions, both general and specific, which give rise to the possibility that actual results or events could differ materially from our expectations expressed in or implied by such forward-looking statements and that our business outlook, objectives, plans and strategic priorities may not be achieved. As a result, we cannot guarantee that any forward-looking statement will materialize and we caution you against relying on any of these forward-looking statements. The forward-looking statements contained in this news release describe our expectations as of May 26, 2015 and, accordingly, are subject to change after such date. Except as may be required by Canadian securities laws, we do not undertake any obligation to update or revise any forward-looking statements contained in this news release, whether as a result of new information, future events or otherwise. Except as otherwise indicated by CAE, forward-looking statements do not reflect the potential impact of any special items or of any dispositions, monetizations, mergers, acquisitions, other business combinations or other transactions that may occur after May 26, 2015. The financial impact of these transactions and special items can be complex and depends on the facts particular to each of them. We therefore cannot describe the expected impact in a meaningful way or in the same way we present known risks affecting our business. Forward-looking statements are presented in this news release for the purpose of assisting investors and others in understanding certain key elements of our expected fiscal 2016 financial results and in obtaining a better understanding of our anticipated operating environment. Readers are cautioned that such information may not be appropriate for other purposes. The value of capital investments expected to be made by CAE in FY2016 assumes that capital investments will be made in accordance with our current annual plan. However, there can be no assurance that such investment levels will be maintained with the result that the value of actual capital investments made by CAE during such period could materially differ from current expectations.
Material Assumptions
A number of economic, market, operational and financial assumptions were made by CAE in preparing its forward-looking statements for fiscal 2016 contained in this news release, including, but not limited to certain economic and market assumptions including: modest economic growth and interest rates to remain largely unchanged in fiscal 2016; a sustained level of competition in civil, defence & healthcare markets; no material financial, operational or competitive consequences of changes in regulations affecting our business; and a relatively stable defence market.
Assumptions Concerning our Businesses
A number of assumptions concerning CAE's business were also made in the preparation of its forward-looking statements for fiscal 2016 contained in this news release, including, but not limited to factors including: productivity and efficiency gains to lower CAE's manufacturing costs and cycle times; maintenance of CAE's market share in civil simulator sales in the face of price competition from recent market entrants; higher Civil training network utilization; and lower total capital expenditure requirements. The foregoing assumptions, although considered reasonable by CAE on May 26, 2015, may prove to be inaccurate. Accordingly, our actual results could differ materially from our expectations as set forth in this news release.
Material Risks
Important risk factors that could cause our assumptions and estimates to be inaccurate and actual results or events to differ materially from those expressed in or implied by our forward-looking statements, including our fiscal 2016 financial guidance, are set out in CAE's 2014 Annual MD&A (included in the CAE 2014 Annual Report) and CAE's FY2015 First, Second & Third Quarter MD&A reports for FY2015, filed by CAE with the Canadian provincial securities regulatory authorities (available at Sedar.com) and with the U.S. Securities and Exchange Commission (available at SEC.gov). These documents are also available at CAE.com. The realization of our forward-looking statements, including our ability to meet our fiscal 2016 outlook, essentially depends on our business performance which, in turn, is subject to many risks. Accordingly, readers are cautioned that any of the disclosed risks could have a material adverse effect on our forward-looking statements. We caution that the disclosed list of risk factors is not exhaustive and other factors could also adversely affect our results.
Non-GAAP and other financial measures
This press release includes non-GAAP and other financial measures. Non-GAAP measures are useful supplemental information but may not have a standardized meaning according to GAAP. These measures should not be confused with, or used as an alternative for, performance measures calculated according to GAAP. They should also not be used to compare with similar measures from other companies. Management believes that providing certain non-GAAP measures provides users with a better understanding of our results and trends and provides additional information on our financial and operating performance.
(1) Operating profit is non-GAAP measure that shows us how we have performed before the effects of certain financing decisions and tax structures. We track operating profit because we believe it makes it easier to compare our performance with previous periods, and with companies and industries that do not have the same capital structure or tax laws.
(2) Total backlog is non-GAAP measure that includes obligated backlog, joint venture backlog and unfunded backlog. Obligated backlog represents the expected value of orders we have received but have not yet executed. Joint venture backlog is obligated backlog that represents the expected value of our share of orders that our joint ventures have received but have not yet executed. Unfunded backlog represents firm Defence and Security orders we have received but have not yet executed for which funding authorization has not yet been obtained, in which we include unexercised negotiated options which we view as having a high probability of being exercised, but exclude indefinite-delivery/indefinite-quantity (IDIQ) contracts.
(3) The book-to-sales ratio is the total orders divided by total revenue in the period.
(4) Maintenance capital expenditure is a non-GAAP measure we use to calculate the investment needed to sustain the current level of economic activity. Growth capital expenditure is a non-GAAP measure we use to calculate the investment needed to increase the current level of economic activity.
(5) Segment operating income (SOI) is a non-GAAP measure and our key indicator of each segment's financial performance. This measure gives us a good indication of the profitability of each segment because it does not include the impact of any items not specifically related to the segment's performance. We calculate it by using segment operating profit, including the after tax share in profit of equity accounted investees and excluding net finance expense, income taxes and other items not specifically related to the segment's performance.
(6) Simulator equivalent unit (SEU) is an operating measure we use to show the total average number of FFSs available to generate earnings during the period.
(7) Free cash flow is a non-GAAP measure that shows us how much cash we have available to invest in growth opportunities, repay debt and meet ongoing financial obligations. We use it as an indicator of our financial strength and liquidity. We calculate it by taking the net cash generated by our continuing operating activities, subtracting maintenance capital expenditures, investment in other assets not related to growth and dividends paid and adding proceeds from the disposal of property, plant and equipment, dividends received from equity accounted investees and proceeds, net of payments, from equity accounted investees.
(8) Net debt is a non-GAAP measure we use to monitor how much debt we have after taking into account liquid assets such as cash and cash equivalents. We use it as an indicator of our overall financial position, and calculate it by taking our total long-term debt, including the current portion of long-term debt, and subtracting cash and cash equivalents.
(9) Net debt-to-capital is calculated as net debt divided by the sum of total equity plus net debt.
(10) Return on capital employed (ROCE) is a non-GAAP measure we use to evaluate the profitability of our invested capital. We calculate this ratio over a rolling four-quarter period by taking net income attributable to equity holders of the Company excluding net finance expense, after tax, divided by the average capital employed
(11) Utilization rate is an operating measure we use to assess the performance of our simulator training network. We calculate it by taking the number of training hours sold on our simulators during the period divided by the practical training capacity available for the same period.
For a detailed reconciliation of these measures as well as other non-GAAP and other financial measures monitored by CAE, please refer to CAE's management's discussion and analysis filed with the Canadian Securities Administrators available on our website (www.cae.com) and on SEDAR (www.sedar.com).
Contacts
Investor Relations:
Andrew Arnovitz, Vice President, Strategy and Investor Relations
1-514-734-5760, [email protected]
Media:
Hélène V. Gagnon, Vice President, Public Affairs and Global Communications
1-514-340-5536, [email protected]