16.0% combined Civil and 15.4% combined Military operating margins
Record 43 Civil full-flight simulator (FFS) sales announced year to date
Civil book-to-sales(1) of 1.17x; Military book-to-sales of 1.19x for consolidated $4.1 billion backlog(2)
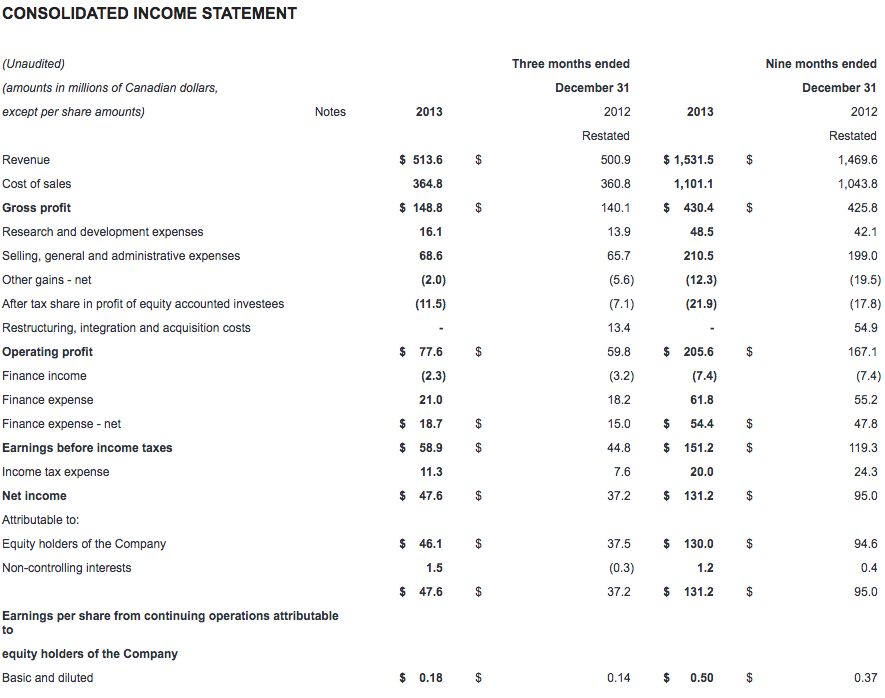
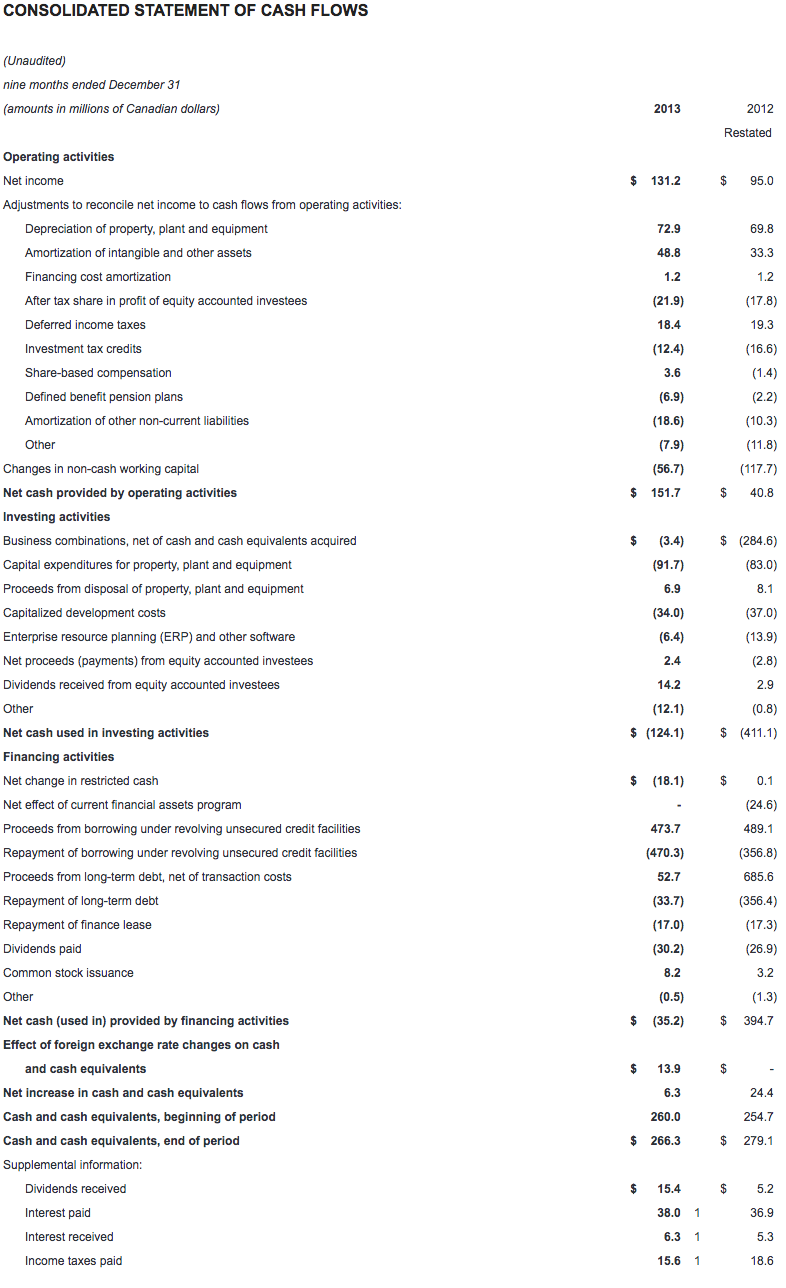
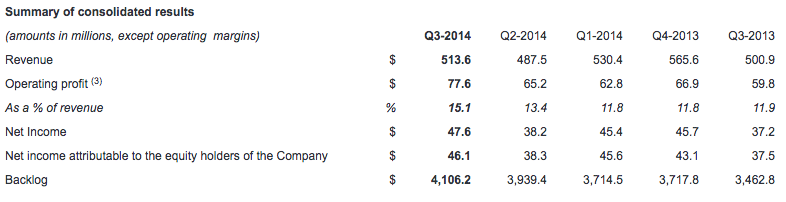
CAE today reported financial results for the third quarter ended December 31, 2013. Net income attributable to equity holders was $46.1 million ($0.18 per share) this quarter, compared to $37.5 million ($0.14 per share) last year. Revenue for the quarter was $513.6 million, compared to $500.9 million in the third quarter last year. All financial information is in Canadian dollars.
"Our performance improved across the board in the third quarter with higher operating margins and a strong order intake," said Marc Parent, CAE's President and Chief Executive Officer. "We have increased confidence for a strong second half with high-teens margins in Civil and continued resiliency in defence. Our operational discipline is driving positive results, and with a clearer outlook for defence, and a robust commercial aerospace market, we are positioned for continued growth."
Civil segments
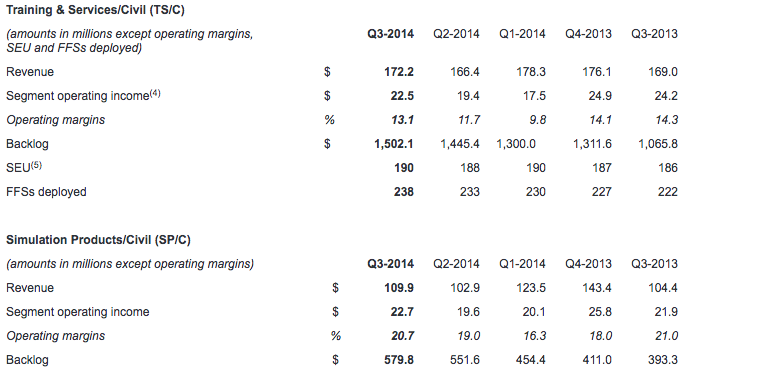
Revenue for our combined Civil segments grew 3% in the third quarter to $282.1 million compared to $273.4 million last year. Third quarter operating income was $45.2 million (16.0% of revenue) compared to $39.0 million (14.5% of revenue) last quarter and $46.1 million (16.9% of revenue) last year.
We received 12 FFS orders in the third quarter and have since announced another three, bringing us to a record 43 year to date. During the quarter we signed long-term training agreements with airlines and operators including Japan Airlines, Virgin Australia Regional Airlines, Air Transat and Jetflite. Since the end of the quarter, CAE has been selected as the exclusive Dassault-Approved Training Provider for the newly-launched Falcon 5X long-range business jet. We received $329.2 million in combined civil segment orders this quarter for a book-to-sales ratio of 1.17x. Third quarter Civil backlog was a record $2.1 billion.
Military segments
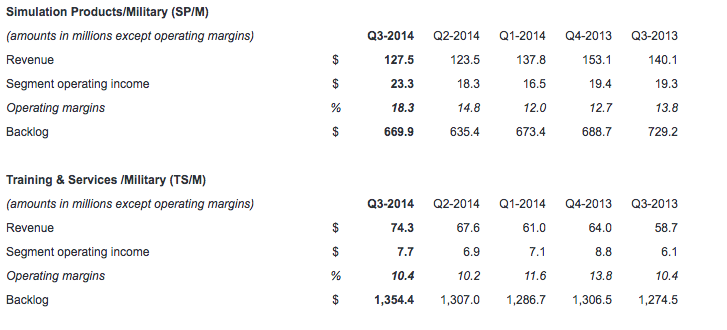
Revenue for our combined Military segments grew 2% in the third quarter to $201.8 million compared to $198.8 million last year. Combined Military operating income was $31.0 million (15.4% of revenue) for the quarter, compared to $25.4 million (12.8% of revenue) last year.
We booked orders during the quarter for simulators, upgrades and services for enduring aircraft platforms including the MH-60R Seahawk helicopter for the Royal Danish Navy, the P-8A Poseidon aircraft for the US Navy, and the C-130 Hercules aircraft for the US Air Force. On new aircraft programs for CAE, we signed contracts for a comprehensive ground-based training system on the T-6C aircraft for the Mexican Air Force, an Unmanned Aerial System Mission Trainer for the General Atomics Predator for the Italian Air Force, and aircrew training services for the T-44C Pegasus for the US Navy. We had success broadening our core market with the signature of a ten-year agreement with the Brunei Ministry of Home Affairs to establish a training centre and conduct emergency management training. In total, we received $240.3 million in combined military segment orders this quarter, representing a book-to-sales ratio of 1.19x. Third quarter Military backlog was $2.0 billion and we had an additional $435.4 million of unfunded backlog(6).
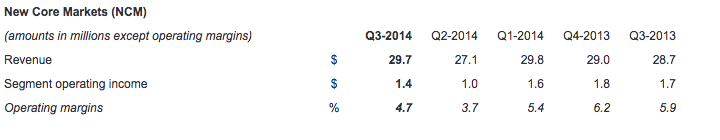
New Core Markets
Revenue in New Core Markets was $29.7 million for the quarter, compared to $28.7 million last year. Operating income was $1.4 million compared to $1.7 million last year.
In CAE Healthcare, we made further inroads in the defence market with the sale of a record 44 Caesar Trauma Patient Simulators to the U.S. Navy Expeditionary Combat Command. We also sold our centre management, ultrasound simulators and patient simulators to a variety of teaching institutions in the U.S. Since the end of the quarter, we unveiled the CAE Fidelis Maternal Fetal Simulator at IMSH - the world's largest healthcare simulation conference. The new simulator was developed to help healthcare instructors to improve training and patient outcomes in the event of serious complications arising from childbirth.
In CAE Mining, we released a major update to enhance the performance and functionality of our flagship resource modelling solution. We sold resource modeling, open pit and underground mine planning software and geological and engineering services to customers globally.
Additional financial highlights
Income taxes this quarter were $11.3 million representing an effective tax rate of 19%, compared to 17% last year. The increase in the effective tax rate was mainly due to a change in the mix of income from various jurisdictions.
Free cash flow(7) was negative $12.7 million this quarter. The decrease from last quarter was mainly attributable to unfavorable changes in non-cash working capital(8), dividends from certain joint ventures, and lower cash from operations.
For the year to date, free cash flow was positive $95.5 million, or $117.2 million higher than the same period last year. The increase was mainly due to favourable changes in non-cash working capital and an increase in cash provided by operating activities.
Capital expenditures(9) totaled $37.2 million this quarter with $22.8 million for growth this quarter and $60.7 million year to date. Maintenance capital expenditures were $14.4 million this quarter and $31.0 million for the first nine months.
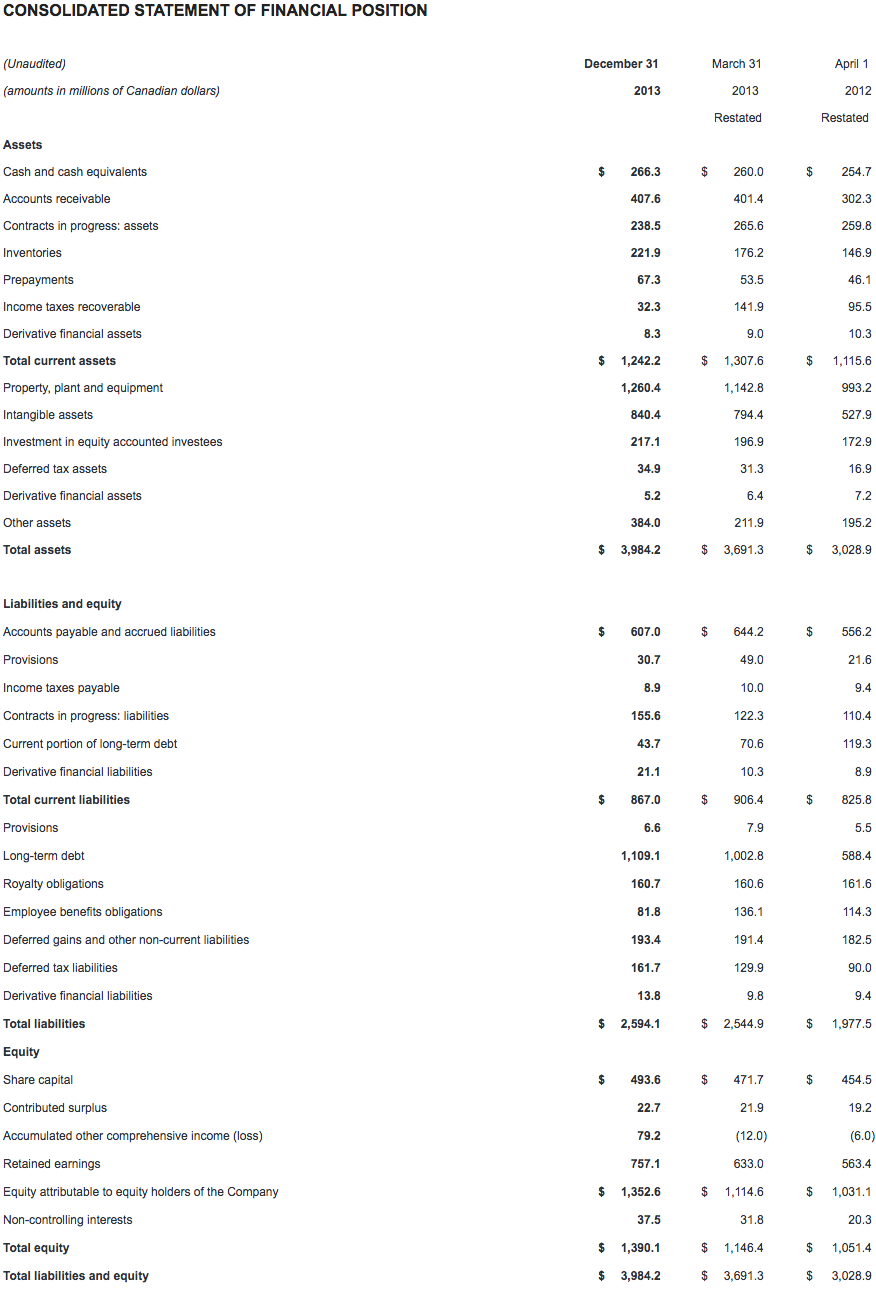
Net debt(10) was $886.5 million as at December 31, 2013, compared to $810.4 million as at September 30, 2013. Our net debt-to-total capital(11) ratio remained stable at 39%.
CAE will pay a dividend of $0.06 per share effective March 31, 2014 to shareholders of record at the close of business on March 14, 2014.
Additional information
You will find a more detailed discussion of our results by segment in the Management's Discussion and Analysis (MD&A) as well as in our consolidated interim financial statements which are posted on our website at www.cae.com/investors.
CAE's unaudited consolidated interim financial statements and management's discussion and analysis for the quarter ended December 31, 2013 have been filed with the Canadian securities commissions and are available on our website (www.cae.com) and on SEDAR (www.sedar.com). They have also been filed with the U.S. Securities and Exchange Commission and are available on their website (www.sec.gov).
Conference call Q3 FY2014
CAE will host a conference call focusing on fiscal year 2014 third quarter results today at 1:00 p.m. ET. The call is intended for analysts, institutional investors and the media. Participants can listen to the conference by dialling + 1 877 586 3392 or +1 416 981 9024. The conference call will also be audio webcast live for the public at www.cae.com.
CAE is a global leader in modeling, simulation and training for civil aviation and defence. The company employs approximately 8,000 people at more than 100 sites and training locations in approximately 30 countries. CAE offers civil aviation, military, and helicopter training services in more than 50 locations worldwide and trains approximately 100,000 crewmembers yearly. In addition, the CAE Oxford Aviation Academy offers training to aspiring pilot cadets in 10 CAE-operated flight schools. CAE's business is diversified, ranging from the sale of simulation products to providing comprehensive services such as training and aviation services, integrated enterprise solutions, in-service support and crew sourcing. The company applies simulation expertise and operational experience to help customers enhance safety, improve efficiency, maintain readiness and solve challenging problems. CAE is leveraging its simulation capabilities in new markets such as healthcare and mining. www.cae.com
You will find more information about the risks and uncertainties associated with our business in the MD&A section of our annual report and annual information form for the year ended March 31, 2013. These documents have been filed with the Canadian securities commissions and are available on our website (www.cae.com), on SEDAR (www.sedar.com) and a free copy is available upon request to CAE. They have also been filed with the U.S. Securities and Exchange Commission under Form 40-F and are available on EDGAR (www.sec.gov). The forward-looking statements contained in this news release represent our expectations as of February 11, 2014 and, accordingly, are subject to change after this date. We do not update or revise forward-looking information even if new information becomes available unless legislation requires us to do so. You should not place undue reliance on forward-looking statements.
Non-GAAP and other financial measures
This press release includes non-GAAP and other financial measures. Non-GAAP measures are useful supplemental information but may not have a standardized meaning according to GAAP. These measures should not be confused with, or used as an alternative for, performance measures calculated according to GAAP. They should also not be used to compare with similar measures from other companies. Management believes that providing certain non-GAAP measures provides users with a better understanding of our results and trends and provides additional information on our financial and operating performance.
(1) The book-to-sales ratio is the total orders divided by total revenue in the period.
(2) Backlog is a non-GAAP measure that represents the expected value of orders we have received but have not yet executed.
(3) Operating profit is non-GAAP measure that shows us how we have performed before the effects of certain financing decisions and tax structures. We track operating profit because we believe it makes it easier to compare our performance with previous periods, and with companies and industries that do not have the same capital structure or tax laws.
(4) Segment operating income (SOI) is a non-GAAP measure and our key indicator of each segment's financial performance. This measure gives us a good indication of the profitability of each segment because it does not include the impact of any items not specifically related to the segment's performance. We calculate it by using segment operating profit, including the after tax share in profit of equity accounted investees and excluding net finance expense, income taxes, restructuring, integration and acquisition costs and other items not specifically related to the segment's performance.
(5) Simulator equivalent unit (SEU) is a financial measure we use to show the total average number of FFSs available to generate earnings during the period.
(6) Unfunded backlog is a non-GAAP measure that represents firm military orders we have received but have not yet executed for which funding authorization has not yet been obtained. We include unexercised negotiated options with a high probability that they will be exercised, but exclude indefinite-delivery/indefinite-quantity (IDIQ) contracts.
(7) Free cash flow is a non-GAAP measure that shows us how much cash we have available to invest in growth opportunities, repay debt and meet ongoing financial obligations. We use it as an indicator of our financial strength and liquidity. We calculate it by taking the net cash generated by our continuing operating activities, subtracting maintenance capital expenditures, investment in other assets not related to growth and dividends paid and adding proceeds from the disposal of property, plant and equipment, dividends received from equity accounted investees and proceeds, net of payments, from equity accounted investees.
(8) Non-cash working capital is a non-GAAP measure we use to monitor how much money we have committed in the day-to-day operation of our business. We calculate it by taking current assets (not including cash and cash equivalents or the current portion of assets held-for-sale) and subtracting current liabilities (not including the current portion of long-term debt or the current portion of liabilities related to assets held-for-sale).
(9) Maintenance capital expenditure is a non-GAAP measure we use to calculate the investment needed to sustain the current level of economic activity. Growth capital expenditure is a non-GAAP measure we use to calculate the investment needed to increase the current level of economic activity.
(10) Net debt is a non-GAAP measure we use to monitor how much debt we have after taking into account liquid assets such as cash and cash equivalents. We use it as an indicator of our overall financial position, and calculate it by taking our total long-term debt, including the current portion of long-term debt, and subtracting cash and cash equivalents.
(11) Net debt-to-capital is calculated as long-term debt, including current portion of long-term debt, less cash and cash equivalents (net debt), divided by the sum of shareholder's equity plus net debt.
For a detailed reconciliation of these measures as well as other non-GAAP and other financial measures monitored by CAE, please refer to CAE's management's discussion and analysis filed with the Canadian securities commissions available on our website (www.cae.com) and on SEDAR (www.sedar.com).
Contacts
Investor relations:
Andrew Arnovitz, Vice President, Investor Relations and Strategy,
(514) 734-5760, [email protected]
Media:
Nathalie Bourque, Vice President, Public Affairs and Global Communications,
(514) 734-5788, [email protected]