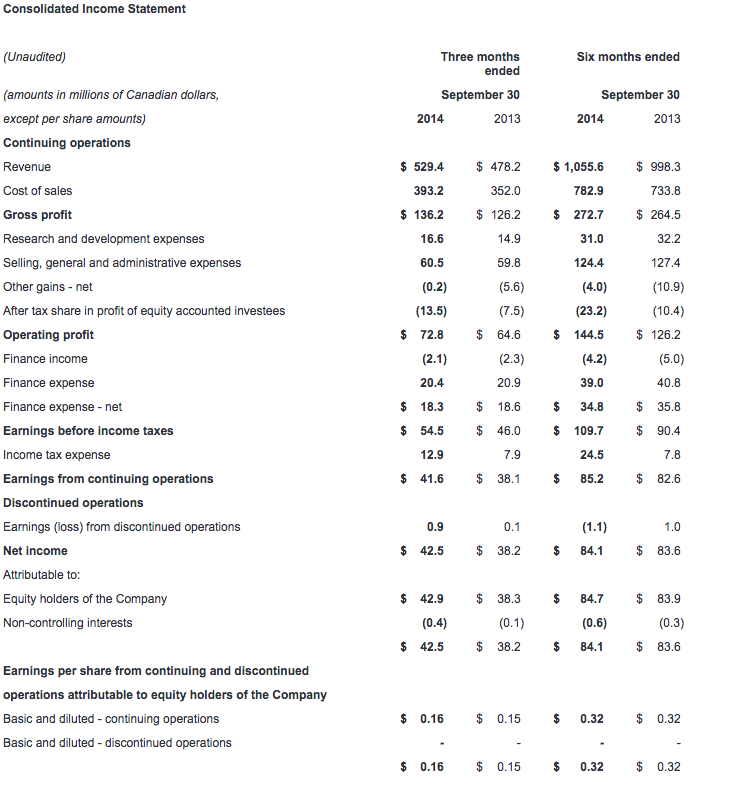
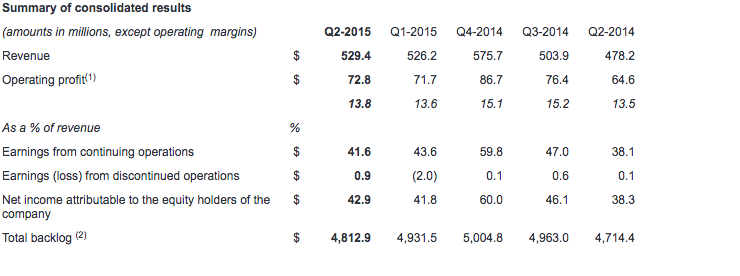
Q2 revenue up 11% over prior year at $529.4 million
Q2 net income to equity holders from continuing operations* up 10% over prior year at $42.0 million
Q2 EPS of $0.16 vs. $0.15 in prior year
CAE today reported financial results for the second quarter ended September 30, 2014. Net income attributable to equity holders from continuing operations was $42.0 million ($0.16 per share) this quarter, compared to $38.2 million ($0.15 per share) in the second quarter last year. Revenue for the quarter was $529.4 million, compared to $478.2 million in the second quarter last year. All financial information is in Canadian dollars.
"Performance for the second quarter was in line with our outlook for growth in Civil and Healthcare, and for resiliency in Defence," said Marc Parent, CAE's President and Chief Executive Officer. "In Civil, we made important progress with our solutions strategy, with Japan Airlines agreeing to conduct all its pilot training at the upcoming CAE-JAL joint venture. In Defence, we received contract extensions and technology upgrades from our existing installed base and long-term services programs. And in Healthcare, we made good progress and continue to be encouraged by our prospects in this growing market. For CAE overall, we are reiterating our expectations for a stronger performance in the second half and solid growth for the year as a whole."
Civil Simulation and Training (Civil)
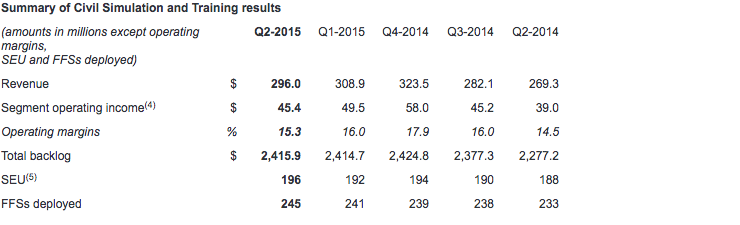
Revenue for Civil was $296.0 million in the second quarter, up 10% compared to $269.3 million last year. Second quarter operating income was $45.4 million (15.3% of revenue), up 16% compared to $39.0 million (14.5% of revenue) last year.
During the quarter we announced a joint venture agreement with Japan Airlines to provide flight crew training services across Northeast Asia. Japan Airlines will conduct all its training at the CAE-JAL joint venture starting in April 2015.
Also during the quarter, we signed solutions agreements with an expected value of $297.5 million, including a long-term contract extension with LATAM Airlines in South America to include training for the new Airbus A350; a contract with Air Algérie in Africa to train 200 new cadets for the airline over the next four years; and, two full-flight simulator (FFS) sales and training centre operations services for customers in the Middle East and Asia. The Civil book-to-sales(3) ratio for the quarter was 1.01x and 1.11x for the last 12 months. Second quarter Civil backlog was $2.4 billion, including our share of joint ventures but not yet including the upcoming joint venture with Japan Airlines.
Defence and Security (Defence)
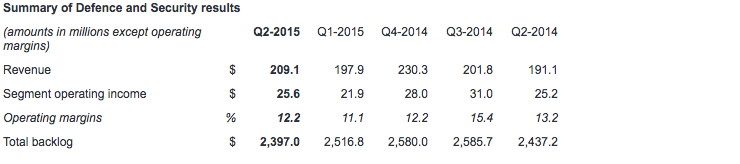
Revenue for Defence was $209.1 million, up 9% compared to $191.1 million last year. Operating income was $25.6 million (12.2% of revenue), up 2% compared to $25.2 million (13.2% of revenue) last year.
During the quarter, we continued to expand our base of long-term, recurring services contracts and our worldwide customer fleet of flight training devices with new deployments, contract extensions and technology upgrades. The U.S. Air Force exercised options on existing contracts to provide training services for the Predator/Reaper remotely piloted vehicles and the KC-135 tanker aircraft, and the U.S. Navy also exercised options for training on the T-44C aircraft. We also received contracts to upgrade simulators for the German Air Force's Eurofighter, the Royal Canadian Air Force's CP-140 Aurora, the U.S. Air Force's C-5 Galaxy, and the Royal Australian Air Force's AP-3C Orion aircraft. And, we won orders for a UH-72A Lakota helicopter simulator for the U.S. Army and a C‑130 Fuselage trainer for the U.S. Air Force Reserve Command. The latter contract includes the provision of high-fidelity trauma patient simulators from CAE Healthcare, to create an immersive environment for airmen involved in aeromedical evacuation training. In total, we received $167.4 million in Defence orders this quarter, representing a book-to-sales ratio of 0.80x. The book-to-sales ratio for the last 12 months was 0.89x. Second quarter Defence backlog was $2.4 billion, including joint ventures and unfunded backlog.
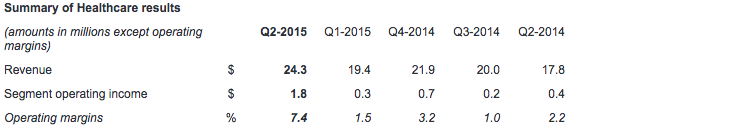
Healthcare
Revenue in Healthcare was up 37% to $24.3 million for the quarter, compared to $17.8 million in the second quarter last year. Operating income was up to $1.8 million (7.4% of revenue) compared to $0.4 million (2.2% of revenue) last year.
We had success across a number of healthcare market segments during the quarter involving sales of our patient and ultrasound simulators, audiovisual solutions, courseware, training and multi-year services. Defence customers included the U.S. Navy and U.S. Air Force Reserve Command as well as a military training centre in Saudi Arabia. In nursing and health science education, we sold patient simulators and multi-year services to the Southeast Technical Institute in the U.S. In the professional and OEM market, we developed a simulation-based training solution for physicians using the Impella® heart pump in partnership with Abiomed.
Additional financial highlights
Income taxes this quarter were $12.9 million representing an effective tax rate of 24%, compared to 17% last year. The higher rate this year results mainly from a change in the mix of income from various jurisdictions.
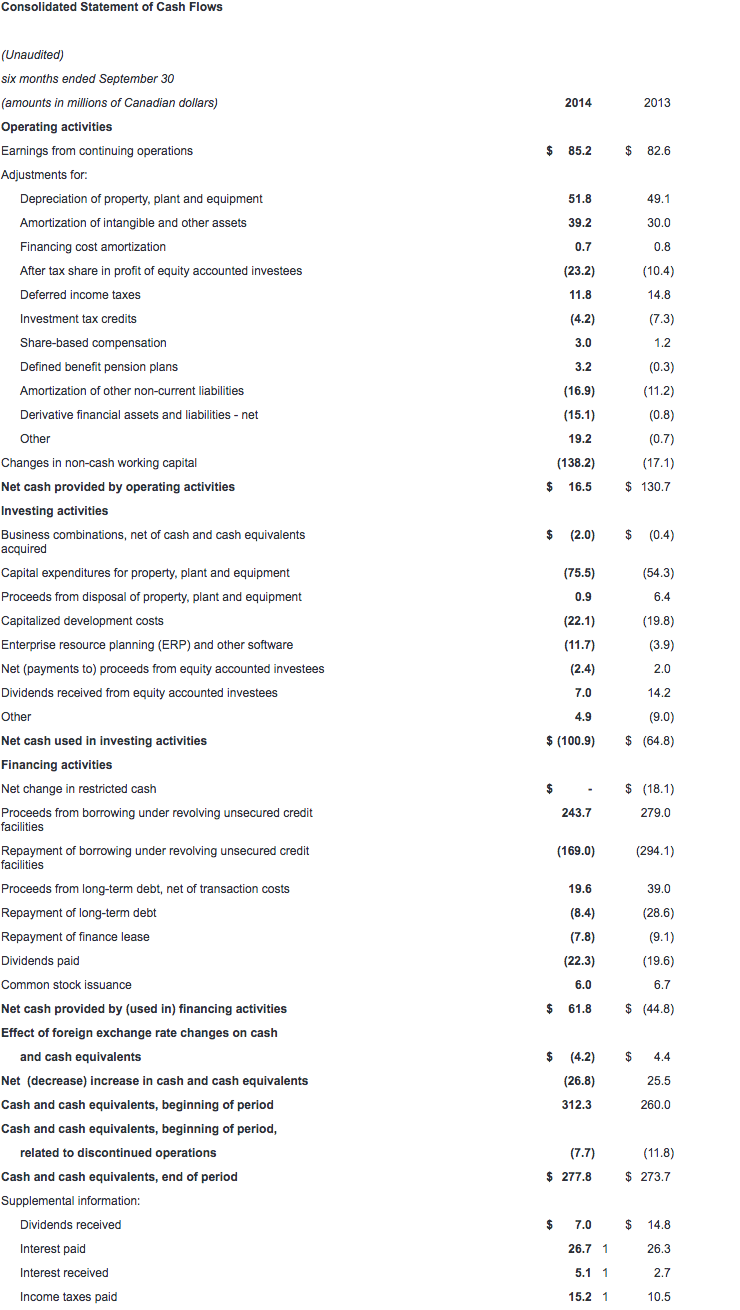
Free cash flow(6) from continuing operations was negative $17.1 million for the second quarter. The increase from last quarter was mainly attributable to favourable changes in non-cash working capital(7), partially offset by lower cash provided by continuing operating activities. The decrease from second quarter last year was mainly due to unfavourable changes in non-cash working capital. We continue to expect stronger free cash flow in the second half of the fiscal year.
Capital expenditures(8) totaled $35.8 million this quarter, with growth expenditures representing 51% of the total and maintenance capital expenditures the balance.
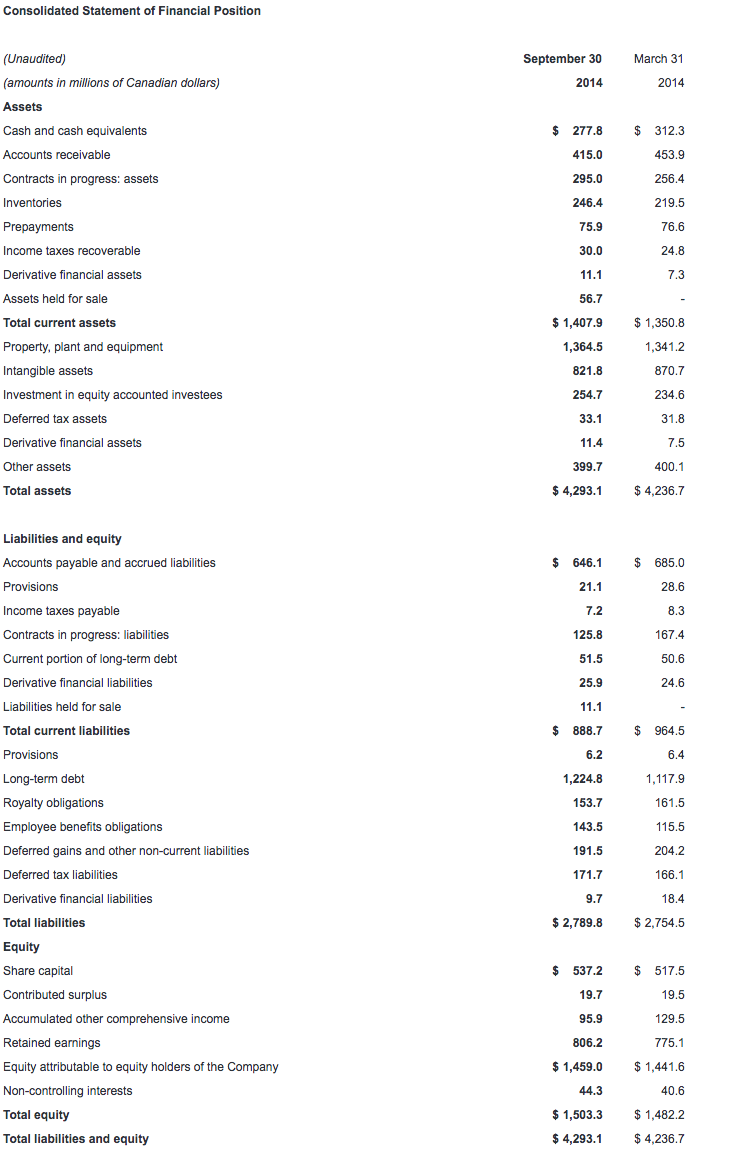
Net debt(9) was $998.5 million as at September 30, 2014, compared to $901.6 million as at June 30, 2014. Approximately one-third of the increase results from foreign exchange on long-term debt. Our net debt-to-capital(10) ratio was 39.9%.
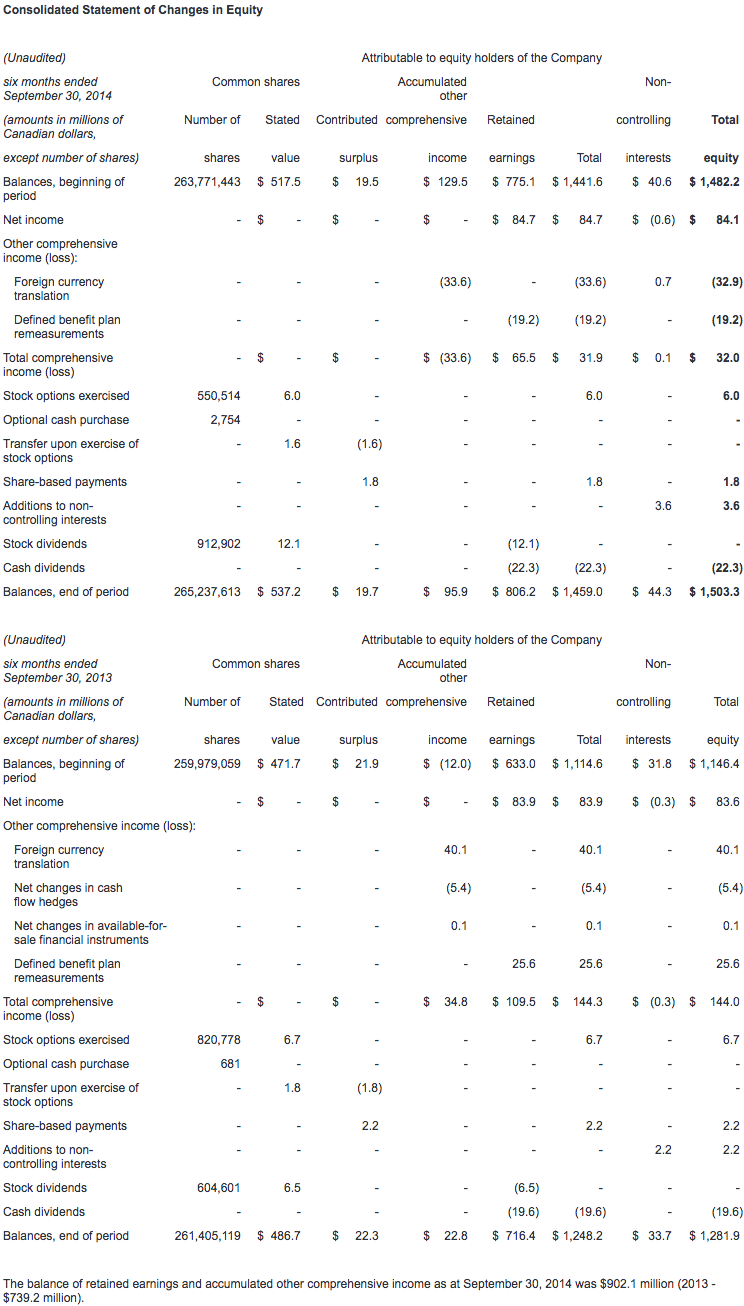
CAE will pay a dividend of $0.07 per share effective December 31, 2014 to shareholders of record at the close of business on December 15, 2014.
Additional information
You will find a more detailed discussion of our results by segment in the Management's Discussion and Analysis (MD&A) as well as in our consolidated interim financial statements which are posted on our website at www.cae.com/investors.
CAE's unaudited consolidated interim financial statements and management's discussion and analysis for the quarter ended September 30th, 2014 have been filed with the Canadian securities commissions and are available on our website (www.cae.com) and on SEDAR (www.sedar.com). They have also been filed with the U.S. Securities and Exchange Commission and are available on their website (www.sec.gov).
Conference call Q2 FY2015
CAE will host a conference call focusing on fiscal year 2015 second quarter results today at 1:00 p.m. ET. The call is intended for analysts, institutional investors and the media. Participants can listen to the conference by dialling + 1 877 586 3392 or +1 416 981 9024. The conference call will also be audio webcast live for the public at www.cae.com.
CAE is a global leader in providing comprehensive training solutions based on world-leading simulation technology and integrated training services. The company employs 8,000 people at more than 160 sites and training locations in 35 countries. Our vision is to be our customers' Partner of Choice and we take a long-term approach to customer relationships. We offer our civil aviation and defence and security customers a complete range of highly innovative product, service and training centre solutions designed to help them meet their mission critical needs for safety, efficiency and readiness. We provide similar solutions to customers in healthcare and mining. CAE has the largest installed base of civil and military flight simulators, supported by a range of after-sales services, and has been serving the needs of its customers for nearly 70 years. We have the broadest training services network in the world and offer civil aviation, military and helicopter training services in 67 locations worldwide and train more than 120,000 civil and military crewmembers annually.
You will find more information about the risks and uncertainties associated with our business in the MD&A section of our annual report and annual information form for the year ended March 31, 2014. These documents have been filed with the Canadian securities commissions and are available on our website (www.cae.com), on SEDAR (www.sedar.com) and a free copy is available upon request to CAE. They have also been filed with the U.S. Securities and Exchange Commission under Form 40-F and are available on EDGAR (www.sec.gov). The forward-looking statements contained in this news release represent our expectations as of November 12, 2014 and, accordingly, are subject to change after this date. We do not update or revise forward-looking information even if new information becomes available unless legislation requires us to do so. You should not place undue reliance on forward-looking statements.
Non-GAAP and other financial measures
This press release includes non-GAAP and other financial measures. Non-GAAP measures are useful supplemental information but may not have a standardized meaning according to GAAP. These measures should not be confused with, or used as an alternative for, performance measures calculated according to GAAP. They should also not be used to compare with similar measures from other companies. Management believes that providing certain non-GAAP measures provides users with a better understanding of our results and trends and provides additional information on our financial and operating performance.
(1) Operating profit is non-GAAP measure that shows us how we have performed before the effects of certain financing decisions and tax structures. We track operating profit because we believe it makes it easier to compare our performance with previous periods, and with companies and industries that do not have the same capital structure or tax laws.
(2) Total backlog is non-GAAP measure that includes obligated backlog, joint venture backlog and unfunded backlog. Obligated backlog represents the expected value of orders we have received but have not yet executed. Joint venture backlog is obligated backlog that represents the expected value of our share of orders that our joint ventures have received but have not yet executed. Unfunded backlog represents firm Defence and Security orders we have received but have not yet executed for which funding authorization has not yet been obtained, in which we include unexercised negotiated options which we view as having a high probability of being exercised, but exclude indefinite-delivery/indefinite-quantity (IDIQ) contracts.
(3) The book-to-sales ratio is the total orders divided by total revenue in the period.
(4) Segment operating income (SOI) is a non-GAAP measure and our key indicator of each segment's financial performance. This measure gives us a good indication of the profitability of each segment because it does not include the impact of any items not specifically related to the segment's performance. We calculate it by using segment operating profit, including the after tax share in profit of equity accounted investees and excluding net finance expense, income taxes and other items not specifically related to the segment's performance.
(5) Simulator equivalent unit (SEU) is an operating measure we use to show the total average number of FFSs available to generate earnings during the period.
(6) Free cash flow is a non-GAAP measure that shows us how much cash we have available to invest in growth opportunities, repay debt and meet ongoing financial obligations. We use it as an indicator of our financial strength and liquidity. We calculate it by taking the net cash generated by our continuing operating activities, subtracting maintenance capital expenditures, investment in other assets not related to growth and dividends paid and adding proceeds from the disposal of property, plant and equipment, dividends received from equity accounted investees and proceeds, net of payments, from equity accounted investees.
(7) Non-cash working capital is a non-GAAP measure we use to monitor how much money we have committed in the day-to-day operation of our business. We calculate it by taking current assets (not including cash and cash equivalents and assets held for sale) and subtracting current liabilities (not including the current portion of long-term debt and liabilities related to assets held for sale).
(8) Maintenance capital expenditure is a non-GAAP measure we use to calculate the investment needed to sustain the current level of economic activity. Growth capital expenditure is a non-GAAP measure we use to calculate the investment needed to increase the current level of economic activity.
(9) Net debt is a non-GAAP measure we use to monitor how much debt we have after taking into account liquid assets such as cash and cash equivalents. We use it as an indicator of our overall financial position, and calculate it by taking our total long-term debt, including the current portion of long-term debt, and subtracting cash and cash equivalents.
(10) Net debt-to-capital is calculated as net debt divided by the sum of total equity plus net debt.
For a detailed reconciliation of these measures as well as other non-GAAP and other financial measures monitored by CAE, please refer to CAE's management's discussion and analysis filed with the Canadian securities commissions available on our website (www.cae.com) and on SEDAR (www.sedar.com).
*Net income attributable to equity holders of the Company from continuing operations
Contacts
Investor relations:
Andrew Arnovitz, Vice President, Strategy and Investor Relations
(514) 734-5760, [email protected]
Media:
Nathalie Bourque, Vice President, Public Affairs and Global Communications,
(514) 734-5788, [email protected]