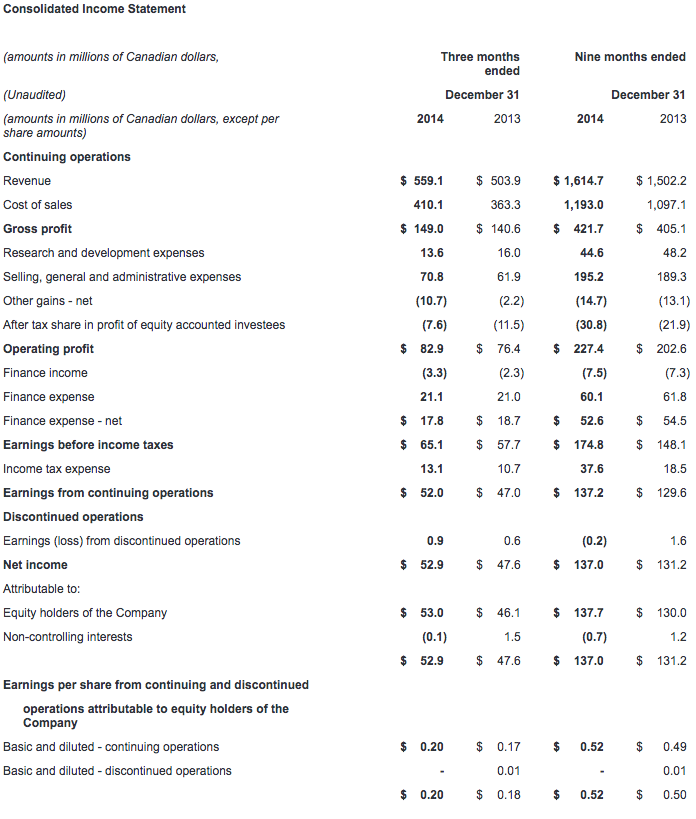
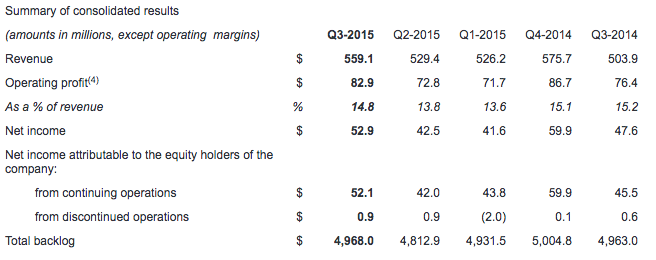
Q3 revenue up 11% over prior year at $559.1 million
Q3 EPS from continuing operations of $0.20 vs. $0.17 in prior year
Q3 orders of $673.4 million for 1.20x book-to-sales(1)
Q3 total backlog(2) reached $5 billion
CAE today reported financial results for the third quarter ended December 31, 2014. Net income attributable to equity holders from continuing operations was $52.1 million ($0.20 per share) this quarter, compared to $45.5 million ($0.17 per share) in the third quarter last year. Revenue for the quarter was $559.1 million, compared to $503.9 million in the third quarter last year. All financial information is in Canadian dollars.
"The Company had double-digit earnings growth in the third quarter, with good free cash flow(3) and order intake," said Marc Parent, CAE's President and Chief Executive Officer. "In Civil, we saw strong demand for simulators and continued airline outsourcing of training to CAE as Partner of Choice. In Defence, we received a range of orders on new and existing programs that demonstrate our platform diversity and geographic reach. And in Healthcare, we continued our success in penetrating global markets with orders including a large deal in Central Asia. For CAE overall, third-quarter performance gives confidence to our outlook for a stronger second half of the fiscal year."
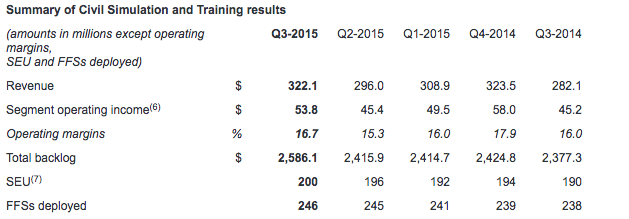
Civil Simulation and Training (Civil)
Revenue for Civil was $322.1 million in the third quarter, up 14% compared to $282.1 million last year. Third quarter operating income was $53.8 million (16.7% of revenue), up 19% compared to $45.2 million (16.0% of revenue) last year.
We signed solutions agreements in Civil with an expected value of $451.5 million, including the sale of 18 full-flight simulators, and training service contracts including an outsourcing agreement renewal with legacy carrier Iberia, and a long-term agreement with Turkish Airlines. We entered into a new joint venture (JV) with China Eastern Airlines, involving the sale of half of CAE's stake in our flight academy in Melbourne, Australia. As well, the airline will outsource the training of more than 650 of its cadet pilots to the JV over the next five years. We also signed a new training services agreement with Ryanair for the recruitment, selection, and type-rating training of new pilot cadets and experienced captains. Simulator utilization(5) in our training centres was 68% in the quarter, and we had 31 FFS sales for the first nine months of the fiscal year. The Civil book-to-sales ratio for the quarter was 1.40x and 1.17x for the last 12 months. Third quarter Civil backlog was $2.6 billion, including our share of joint ventures.
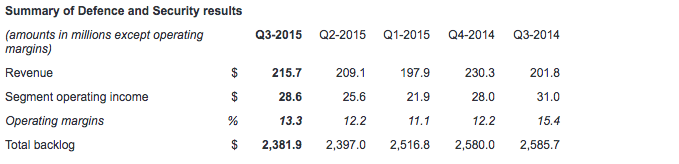
Defence and Security (Defence)
Revenue for Defence was $215.7 million, up 7% compared to $201.8 million last year. Operating income was $28.6 million (13.3% of revenue), down 8% compared to $31.0 million (15.4% of revenue) last year.
During the quarter, we signed contracts in Defence for simulator updates for New Zealand's SH-2G Super Seasprite helicopter, and the UK Royal Navy's Merlin, as well as an order to upgrade a Predator UAV Trainer for an undisclosed customer. We received new product orders for a C295 transport aircraft simulator for the Polish Air Force, a UH72 Lakota helicopter simulator for the US Army, and a KC-130J Weapons Systems Trainer for the US Marine Corps. We also received training services contracts from our Rotorsim joint venture, the German Army Aviation School, and a training needs analysis contract for the German-French Tiger Technical School. In total, we received $200.6 million in Defence orders this quarter, representing a book-to-sales ratio of 0.93x. The book-to-sales ratio for the last 12 months was 0.83x. Third quarter Defence backlog was $2.4 billion, including joint ventures and unfunded backlog.
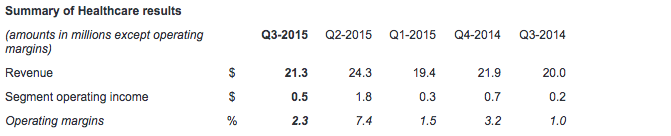
Healthcare
Revenue in Healthcare was $21.3 million for the quarter, compared to $20.0 million in the third quarter last year. Operating income was $0.5 million compared to $0.2 million last year.
We signed new sales and distribution agreements this quarter, across the globe. We entered agreements with new distributors for our products in Europe and across Asia, and we sold a range of our patient, interventional, and ultrasound simulators to public hospitals in China. We had our largest healthcare order to date with an approximate $11 million dollar sale of a turnkey training centre solution in Central Asia, involving a broad range of CAE simulator solutions, and audiovisual solutions, as well as training and support services. In North America, we sold simulators to an Air Force training centre in the US and to a Canadian university.
Additional financial highlights
Income taxes this quarter were $13.1 million representing an effective tax rate of 20%, compared to 19% last year. The higher rate this year results mainly from a change in the mix of income from various jurisdictions.
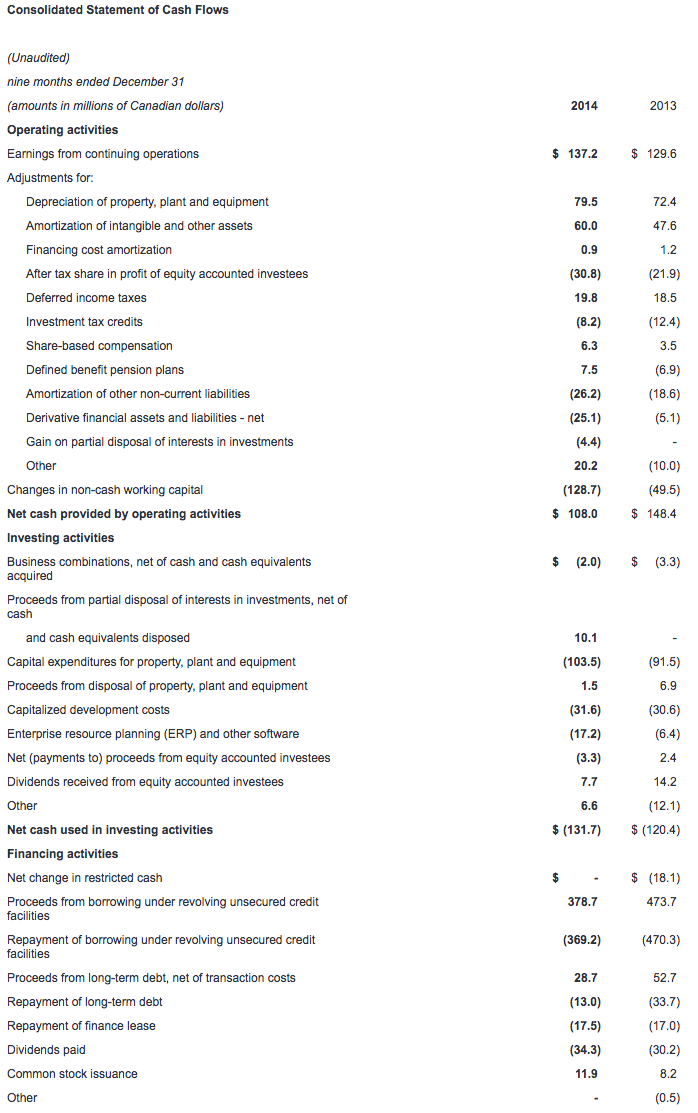
Free cash flow from continuing operations was $70.0 million for the third quarter. The increase from last quarter and last year was mainly attributable to favourable changes in non-cash working capital(8), and higher cash provided by continuing operating activities.
Capital expenditures(9) totaled $28.0 million this quarter, with growth expenditures representing 78% of the total and maintenance capital expenditures the balance.
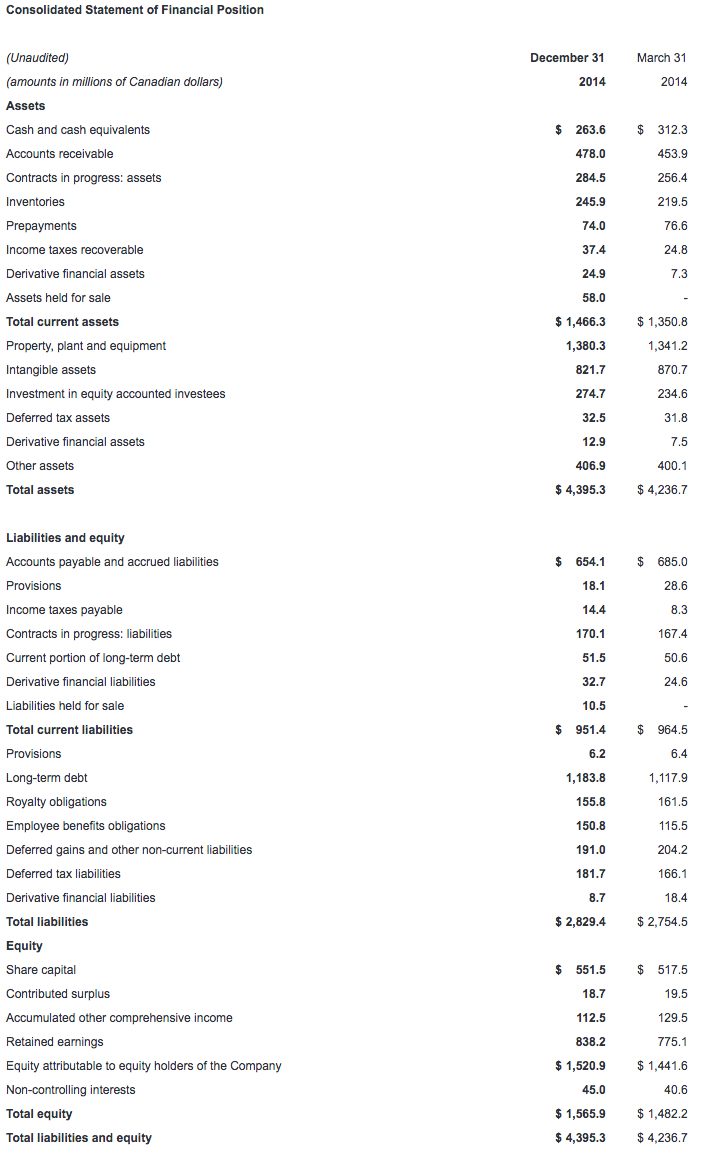
Net debt(10) was $971.7 million as at December 31, 2014, compared to $998.5 million as at September 30, 2014, lowering our net debt-to-capital(11) ratio to 38.3%.
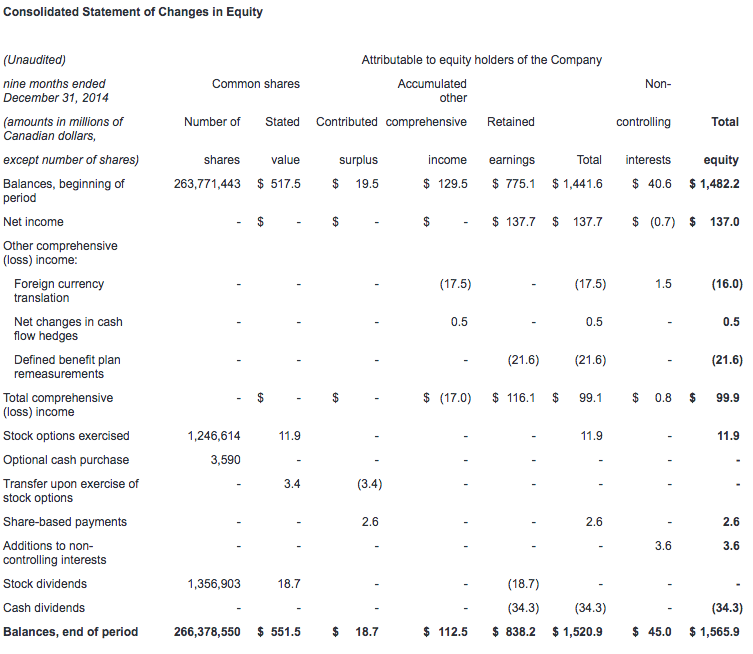
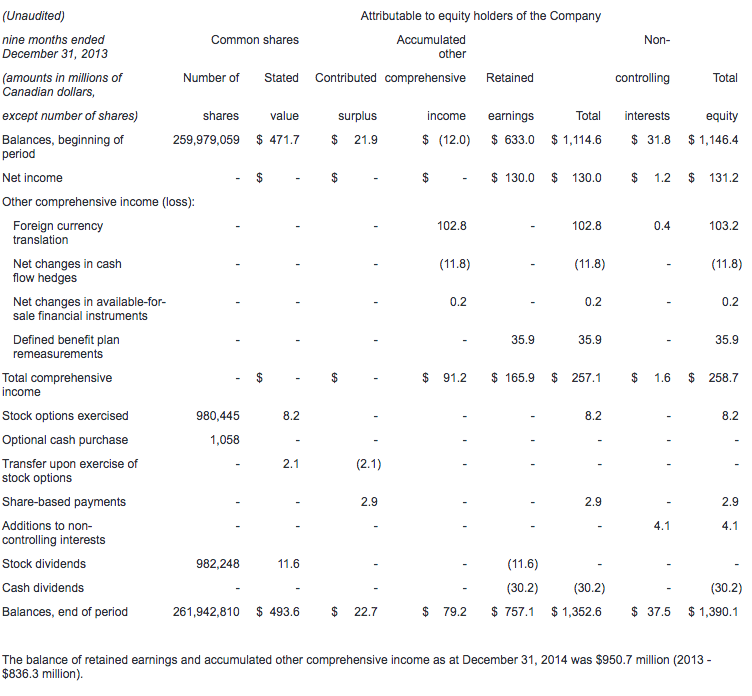
CAE will pay a dividend of $0.07 per share effective March 31, 2015 to shareholders of record at the close of business on March 13, 2015.
Additional information
You will find a more detailed discussion of our results by segment in the Management's Discussion and Analysis (MD&A) as well as in our consolidated interim financial statements which are posted on our website at www.cae.com/investors.
CAE's unaudited consolidated interim financial statements and management's discussion and analysis for the quarter ended December 31, 2014 have been filed with the Canadian securities commissions and are available on our website (www.cae.com) and on SEDAR (www.sedar.com). They have also been filed with the U.S. Securities and Exchange Commission and are available on their website (www.sec.gov).
Conference call Q3 FY2015
CAE will host a conference call focusing on fiscal year 2015 third quarter results today at 1:00 p.m. ET. The call is intended for analysts, institutional investors and the media. Participants can listen to the conference by dialling + 1 877 586 3392 or +1 416 981 9024. The conference call will also be audio webcast live for the public at www.cae.com.
CAE is a global leader in providing comprehensive training solutions based on world-leading simulation technology and integrated training services. The company employs 8,000 people at more than 160 sites and training locations in 35 countries. Our vision is to be our customers' Partner of Choice and we take a long-term approach to customer relationships. We offer our civil aviation and defence and security customers a complete range of highly innovative product, service and training centre solutions designed to help them meet their mission critical needs for safety, efficiency and readiness. We provide similar solutions to customers in healthcare and mining. CAE has the largest installed base of civil and military flight simulators, supported by a range of after-sales services, and has been serving the needs of its customers for nearly 70 years. We have the broadest training services network in the world and offer civil aviation, military and helicopter training services in 67 locations worldwide and train more than 120,000 civil and military crewmembers annually.
You will find more information about the risks and uncertainties associated with our business in the MD&A section of our annual report and annual information form for the year ended March 31, 2014. These documents have been filed with the Canadian securities commissions and are available on our website (www.cae.com), on SEDAR (www.sedar.com) and a free copy is available upon request to CAE. They have also been filed with the U.S. Securities and Exchange Commission under Form 40-F and are available on EDGAR (www.sec.gov). The forward-looking statements contained in this news release represent our expectations as of February 6, 2015 and, accordingly, are subject to change after this date. We do not update or revise forward-looking information even if new information becomes available unless legislation requires us to do so. You should not place undue reliance on forward-looking statements.
Non-GAAP and other financial measures
This press release includes non-GAAP and other financial measures. Non-GAAP measures are useful supplemental information but may not have a standardized meaning according to GAAP. These measures should not be confused with, or used as an alternative for, performance measures calculated according to GAAP. They should also not be used to compare with similar measures from other companies. Management believes that providing certain non-GAAP measures provides users with a better understanding of our results and trends and provides additional information on our financial and operating performance.
(1) The book-to-sales ratio is the total orders divided by total revenue in the period.
(2) Total backlog is non-GAAP measure that includes obligated backlog, joint venture backlog and unfunded backlog. Obligated backlog represents the expected value of orders we have received but have not yet executed. Joint venture backlog is obligated backlog that represents the expected value of our share of orders that our joint ventures have received but have not yet executed. Unfunded backlog represents firm Defence and Security orders we have received but have not yet executed for which funding authorization has not yet been obtained, in which we include unexercised negotiated options which we view as having a high probability of being exercised, but exclude indefinite-delivery/indefinite-quantity (IDIQ) contracts.
(3) Free cash flow is a non-GAAP measure that shows us how much cash we have available to invest in growth opportunities, repay debt and meet ongoing financial obligations. We use it as an indicator of our financial strength and liquidity. We calculate it by taking the net cash generated by our continuing operating activities, subtracting maintenance capital expenditures, investment in other assets not related to growth and dividends paid and adding proceeds from the disposal of property, plant and equipment, dividends received from equity accounted investees and proceeds, net of payments, from equity accounted investees.
(4) Operating profit is non-GAAP measure that shows us how we have performed before the effects of certain financing decisions and tax structures. We track operating profit because we believe it makes it easier to compare our performance with previous periods, and with companies and industries that do not have the same capital structure or tax laws.
(5) Utilization rate is an operating measure we use to assess the performance of our simulator training network. We calculate it by taking the number of training hours sold on our simulators during the period divided by the practical training capacity available for the same period.
(6) Segment operating income (SOI) is a non-GAAP measure and our key indicator of each segment's financial performance. This measure gives us a good indication of the profitability of each segment because it does not include the impact of any items not specifically related to the segment's performance. We calculate it by using segment operating profit, including the after tax share in profit of equity accounted investees and excluding net finance expense, income taxes and other items not specifically related to the segment's performance.
(7) Simulator equivalent unit (SEU) is an operating measure we use to show the total average number of FFSs available to generate earnings during the period.
(8) Non-cash working capital is a non-GAAP measure we use to monitor how much money we have committed in the day-to-day operation of our business. We calculate it by taking current assets (not including cash and cash equivalents and assets held for sale) and subtracting current liabilities (not including the current portion of long-term debt and liabilities related to assets held for sale).
(9) Maintenance capital expenditure is a non-GAAP measure we use to calculate the investment needed to sustain the current level of economic activity. Growth capital expenditure is a non-GAAP measure we use to calculate the investment needed to increase the current level of economic activity.
(10) Net debt is a non-GAAP measure we use to monitor how much debt we have after taking into account liquid assets such as cash and cash equivalents. We use it as an indicator of our overall financial position, and calculate it by taking our total long-term debt, including the current portion of long-term debt, and subtracting cash and cash equivalents.
(11) Net debt-to-capital is calculated as net debt divided by the sum of total equity plus net debt.
For a detailed reconciliation of these measures as well as other non-GAAP and other financial measures monitored by CAE, please refer to CAE's management's discussion and analysis filed with the Canadian securities commissions available on our website (www.cae.com) and on SEDAR (www.sedar.com).
Contacts
Investor relations:
Andrew Arnovitz, Vice President, Strategy and Investor Relations
(514) 734-5760, [email protected]
Media:
Nathalie Bourque, Vice President, Public Affairs and Global Communications,
(514) 734-5788, [email protected]