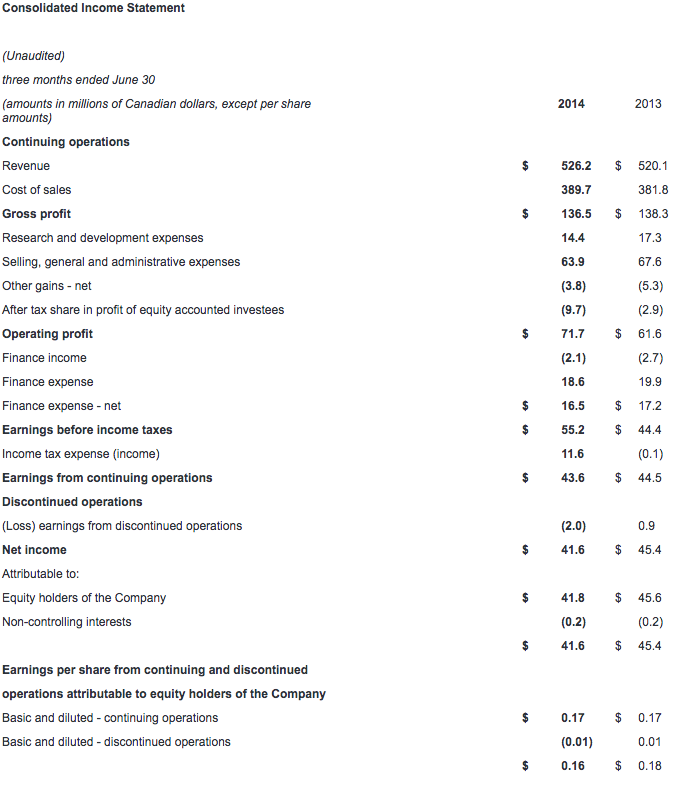
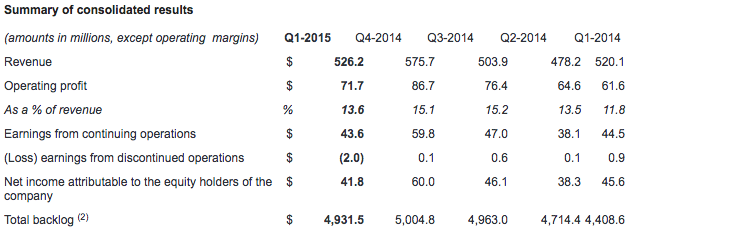
Q1 revenue of $526.2 million and EPS from continuing operations of $0.17 compared to $520.1 million and $0.17 in prior year
Q1 operating profit(1) of $71.7 million compared to $61.6 million in prior year
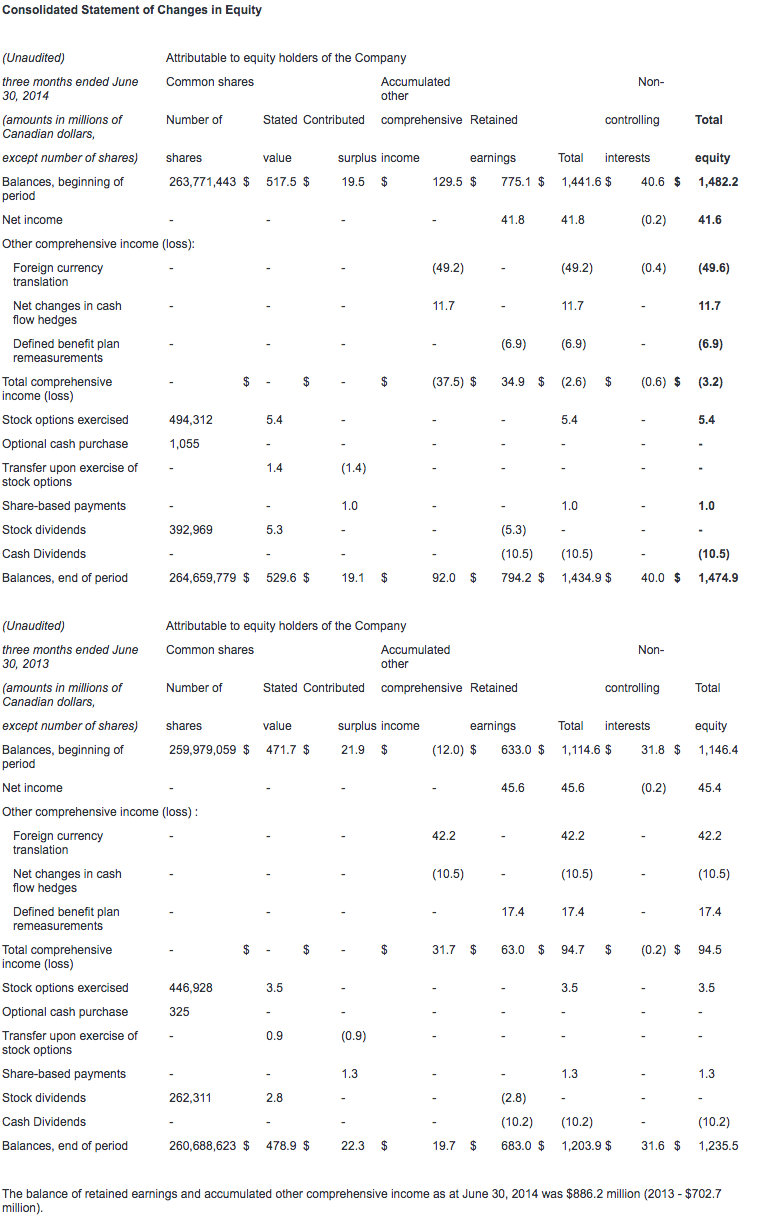
Quarterly dividend to increase $0.01 to $0.07 per share effective September 30, 2014
Mining to be divested
CAE today reported financial results for the first quarter ended June 30, 2014. Net income from continuing operations attributable to equity holders was $43.8 million ($0.17 per share) this quarter, compared to $44.7 million ($0.17 per share) in the first quarter last year. Operating profit was $71.7 million (13.6% of revenue) compared to $61.6 million (11.8% of revenue) in the first quarter last year. Revenue for the quarter was $526.2 million, compared to $520.1 million in the first quarter last year. All financial information is in Canadian dollars.
A strategic review of New Core Markets reaffirmed CAE's conviction in Healthcare and led to a process to divest Mining. The Company will now focus capital and resources on its three remaining core business units: Civil Simulation and Training (Civil); Defence and Security (Defence); and Healthcare.
"The growth in our first quarter operating results came entirely from Civil, which saw operating income increase by 32% over last year," said Marc Parent, CAE's President and Chief Executive Officer. "Defence had stable revenue and lower operating income, owing to the mix of programs in the quarter and persistent delays in government decision-making. I am pleased to report that CAE's Board of Directors has today approved a $0.01 increase to CAE's quarterly dividend, which becomes $0.07 per share, effective September 30, 2014. This marks CAE's fourth dividend increase in as many years and is testament to our confidence in the business. As in the last few years, we expect a stronger performance in the second half and solid growth for the year as a whole."
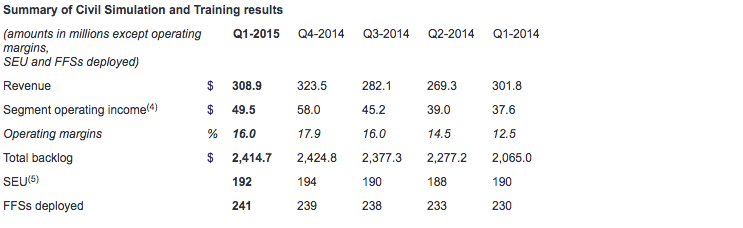
Civil Simulation and Training (Civil)
Revenue for Civil was $308.9 million in the first quarter, up 2% compared to $301.8 million last year. First quarter operating income was $49.5 million (16.0% of revenue), up 32% compared to $37.6 million (12.5% of revenue) last year.
During the quarter we obtained solutions contracts expected to generate future revenues of $365.3 million, including 11 full-flight simulators (FFSs) for airline customers around the world. Orders also included pilot training services for Air Canada, Air Nostrum, Scandinavian Airlines, and British Midland Regional as well as training centre operations services for Caverton Helicopters. The Civil book-to-sales(3) ratio for the quarter was 1.18x and 1.32x for the last 12 months. First quarter Civil backlog was $2.4 billion, including our share of joint ventures.
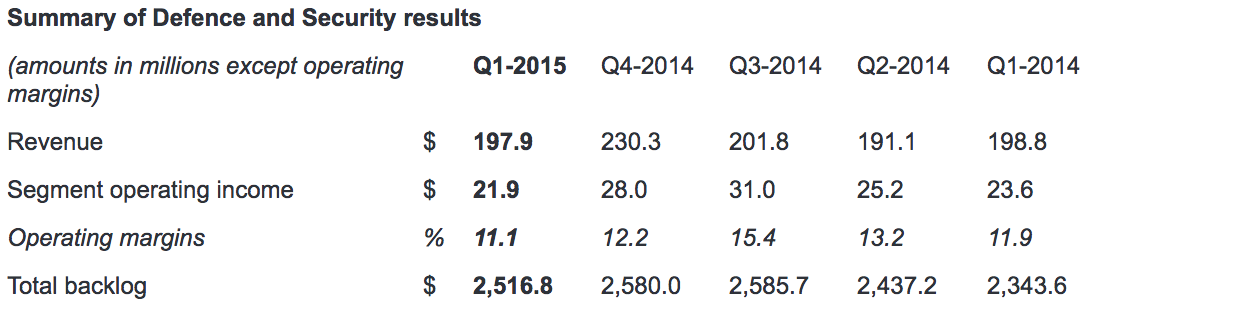
Defence and Security (Defence)
Revenue for Defence was $197.9 million, stable compared to $198.8 million last year. Operating income was $21.9 million (11.1% of revenue), down 7% compared to $23.6 million (11.9% of revenue) last year.
During the quarter, we booked simulator orders, upgrades, and services contracts with customers including NATO for upgrades to its AWACS surveillance aircraft simulators; Beechcraft for training support and maintenance services involving the T-6C aircraft for the Royal New Zealand Air Force; and an undisclosed international customer for a KC-135 refuelling boom trainer. We had success this quarter in the naval domain with a contract for the Swedish Navy to provide a comprehensive Naval Warfare Training System. In total, we received $148.8 million in Defence orders this quarter, representing a book-to-sales ratio of 0.75x. The book-to-sales ratio for the last 12 months was 0.92x. During the quarter, we received an additional $93 million in unfunded orders. First quarter Defence backlog was $2.5 billion, including joint ventures and unfunded backlog.
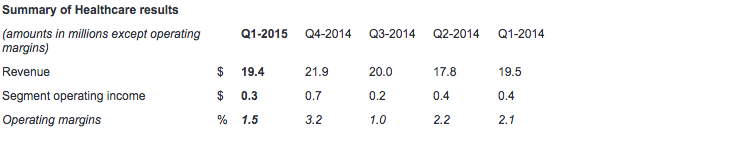
Healthcare
Revenue in Healthcare was $19.4 million for the quarter, compared to $19.5 million in the first quarter last year. Operating income was $0.3 million compared to $0.4 million last year.
We continued to expand our international reach with new distributor agreements in France, South Korea and India. In terms of new product portfolio expansion, we introduced CAE Replay, an audiovisual solution for debrief used to capture both medical simulation scenarios and live clinical events. We also began production of our first Fidelis Maternal Fetal Simulators. During the quarter, we received notable orders throughout the United States and in the U.K., China and Korea from universities, hospitals and medical device companies for our audiovisual solutions, patient simulators and interventional (surgical) simulators.
Additional financial highlights
Income taxes this quarter were $11.6 million representing an effective tax rate of 21%, compared to nil last year. Last year's nil rate was the result of a one-time tax benefit we received in connection with the tax treatment of the depreciation and sale of some simulators in Canada.
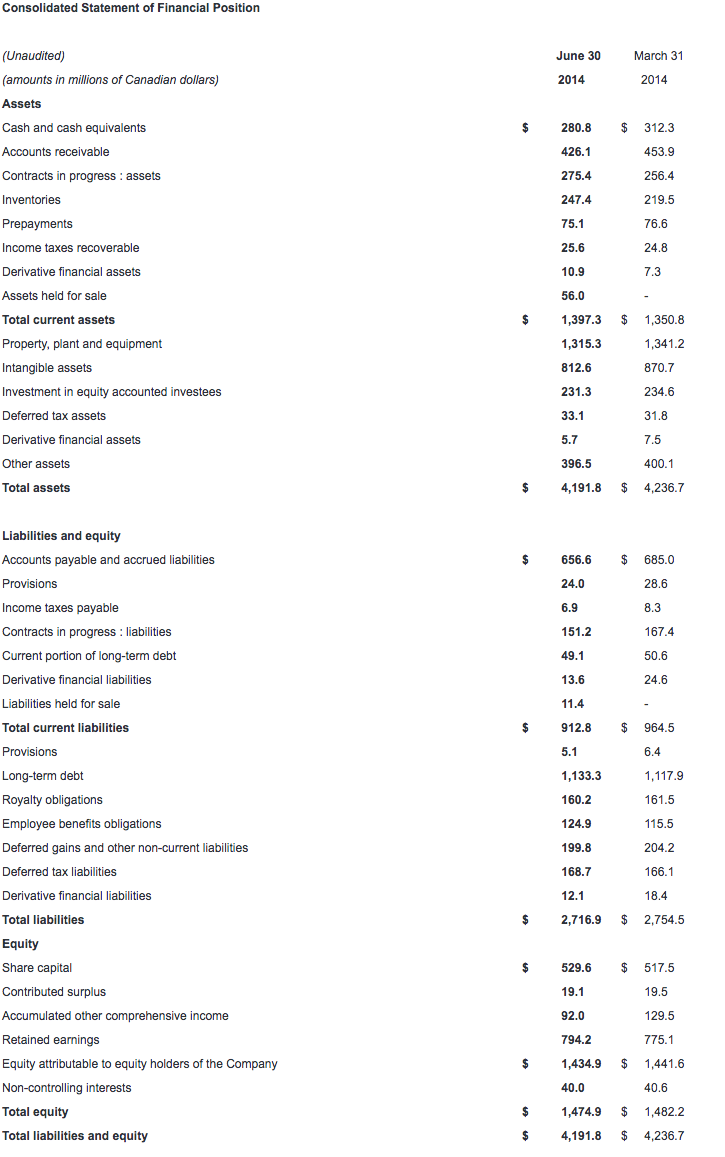
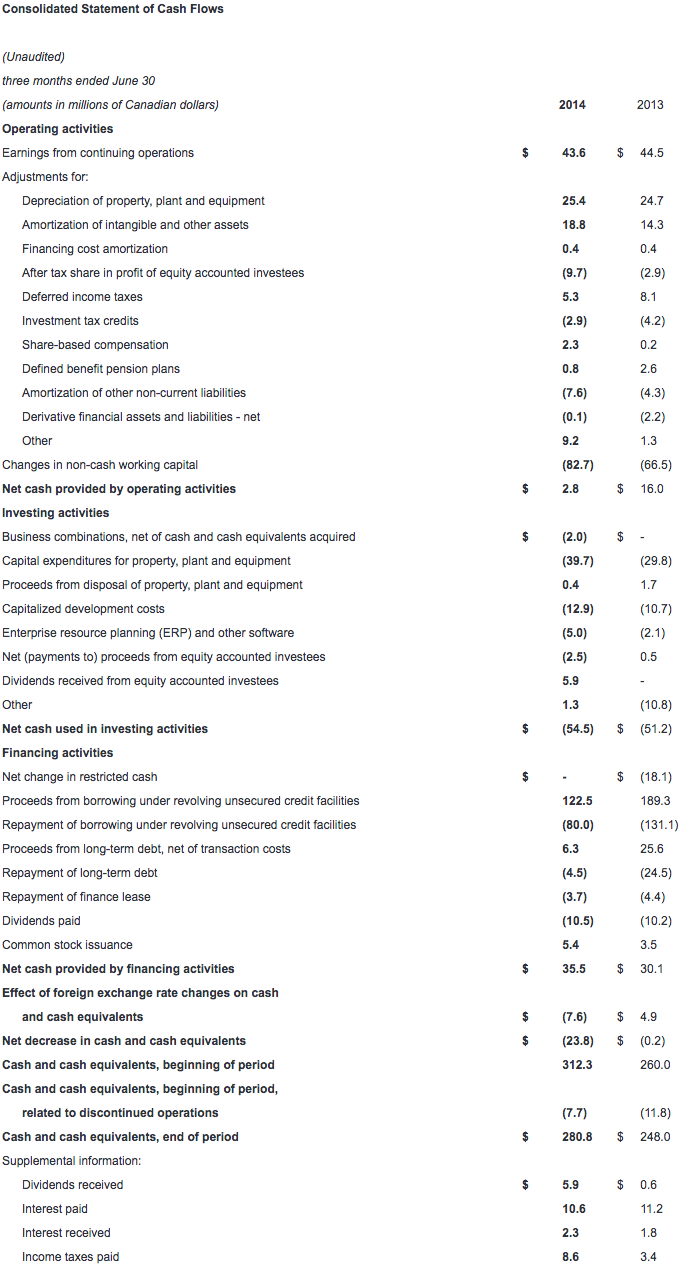
Free cash flow(6) from continuing operations was negative $20.9 million for the first quarter. The decrease from last quarter and the first quarter of fiscal 2014 was mainly attributable to unfavourable changes in non-cash working capital(7), which is due to an increase in contracts in progress assets and inventories.
Capital expenditures(8) totaled $39.7 million this quarter with growth capital expenditures representing two-thirds of the total and maintenance capital expenditures the balance.
Net debt(9) was $901.6 million as at June 30, 2014, compared to $856.2 million as at March 31, 2014. Our net debt-to-capital(10) ratio was 37.9%.
CAE will pay a dividend of $0.07 per share effective September 30, 2014 to shareholders of record at the close of business on September 15, 2014.
Additional information
You will find a more detailed discussion of our results by segment in the Management's Discussion and Analysis (MD&A) as well as in our consolidated interim financial statements which are posted on our website at www.cae.com/investors.
CAE's unaudited consolidated interim financial statements and management's discussion and analysis for the quarter ended June 30, 2014 have been filed with the Canadian securities commissions and are available on our website (www.cae.com) and on SEDAR (www.sedar.com). They have also been filed with the U.S. Securities and Exchange Commission and are available on their website (www.sec.gov).
Conference call Q1 FY2015
CAE will host a conference call focusing on fiscal year 2015 first quarter results today at 1:30 p.m. ET. The call is intended for analysts, institutional investors and the media. Participants can listen to the conference by dialling + 1 877 586 3392 or +1 416 981 9024. The conference call will also be audio webcast live for the public at www.cae.com.
CAE is a global leader in providing comprehensive training solutions based on world-leading simulation technology and integrated training services. The company employs 8,000 people at more than 160 sites and training locations in 35 countries. Our vision is to be our customers' Partner of Choice and we take a long-term approach to customer relationships. We offer our civil aviation and defence and security customers a complete range of highly innovative product, service and training centre solutions designed to help them meet their mission critical needs for safety, efficiency and readiness. We provide similar solutions to customers in healthcare and mining. CAE has the largest installed base of civil and military flight simulators, supported by a range of after-sales services, and has been serving the needs of its customers for nearly 70 years. We have the broadest training services network in the world and offer civil aviation, military and helicopter training services in 67 locations worldwide and train more than 120,000 civil and military crewmembers annually. www.cae.com
You will find more information about the risks and uncertainties associated with our business in the MD&A section of our annual report and annual information form for the year ended March 31, 2014. These documents have been filed with the Canadian securities commissions and are available on our website (www.cae.com), on SEDAR (www.sedar.com) and a free copy is available upon request to CAE. They have also been filed with the U.S. Securities and Exchange Commission under Form 40-F and are available on EDGAR (www.sec.gov). The forward-looking statements contained in this news release represent our expectations as of August 13, 2014 and, accordingly, are subject to change after this date. We do not update or revise forward-looking information even if new information becomes available unless legislation requires us to do so. You should not place undue reliance on forward-looking statements.
Non-GAAP and other financial measures
This press release includes non-GAAP and other financial measures. Non-GAAP measures are useful supplemental information but may not have a standardized meaning according to GAAP. These measures should not be confused with, or used as an alternative for, performance measures calculated according to GAAP. They should also not be used to compare with similar measures from other companies. Management believes that providing certain non-GAAP measures provides users with a better understanding of our results and trends and provides additional information on our financial and operating performance.
(1) Operating profit is non-GAAP measure that shows us how we have performed before the effects of certain financing decisions and tax structures. We track operating profit because we believe it makes it easier to compare our performance with previous periods, and with companies and industries that do not have the same capital structure or tax laws.
(2) Total backlog is non-GAAP measure that includes obligated backlog, joint venture backlog and unfunded backlog. Obligated backlog represents the expected value of orders we have received but have not yet executed. Joint venture backlog is obligated backlog that represents the expected value of our share of orders that our joint ventures have received but have not yet executed. Unfunded backlog represents firm military orders we have received but have not yet executed for which funding authorization has not yet been obtained, in which we include unexercised negotiated options which we view as having a high probability of being exercised, but exclude indefinite-delivery/indefinite-quantity (IDIQ) contracts.
(3) The book-to-sales ratio is the total orders divided by total revenue in the period.
(4) Segment operating income (SOI) is a non-GAAP measure and our key indicator of each segment's financial performance. This measure gives us a good indication of the profitability of each segment because it does not include the impact of any items not specifically related to the segment's performance. We calculate it by using segment operating profit, including the after tax share in profit of equity accounted investees and excluding net finance expense, income taxes and other items not specifically related to the segment's performance.
(5) Simulator equivalent unit (SEU) is an operating measure we use to show the total average number of FFSs available to generate earnings during the period.
(6) Free cash flow is a non-GAAP measure that shows us how much cash we have available to invest in growth opportunities, repay debt and meet ongoing financial obligations. We use it as an indicator of our financial strength and liquidity. We calculate it by taking the net cash generated by our continuing operating activities, subtracting maintenance capital expenditures, investment in other assets not related to growth and dividends paid and adding proceeds from the disposal of property, plant and equipment, dividends received from equity accounted investees and proceeds, net of payments, from equity accounted investees.
(7) Non-cash working capital is a non-GAAP measure we use to monitor how much money we have committed in the day-to-day operation of our business. We calculate it by taking current assets (not including cash and cash equivalents and assets held-for-sale) and subtracting current liabilities (not including the current portion of long-term debt and liabilities related to assets held-for-sale).
(8) Maintenance capital expenditure is a non-GAAP measure we use to calculate the investment needed to sustain the current level of economic activity. Growth capital expenditure is a non-GAAP measure we use to calculate the investment needed to increase the current level of economic activity.
(9) Net debt is a non-GAAP measure we use to monitor how much debt we have after taking into account liquid assets such as cash and cash equivalents. We use it as an indicator of our overall financial position, and calculate it by taking our total long-term debt, including the current portion of long-term debt, and subtracting cash and cash equivalents.
(10) Net debt-to-capital is calculated as net debt divided by the sum of total equity plus net debt.
For a detailed reconciliation of these measures as well as other non-GAAP and other financial measures monitored by CAE, please refer to CAE's management's discussion and analysis filed with the Canadian securities commissions available on our website (www.cae.com) and on SEDAR (www.sedar.com).
Contacts
Investor relations:
Andrew Arnovitz, Vice President, Strategy and Investor Relations
(514) 734-5760, [email protected]
Media:
Nathalie Bourque, Vice President, Public Affairs and Global Communications,
(514) 734-5788, [email protected]