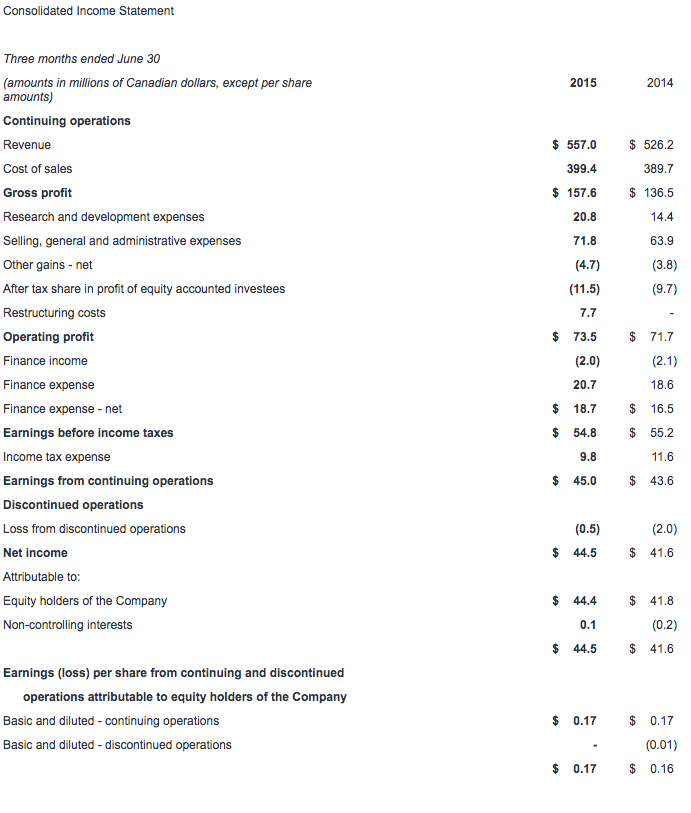
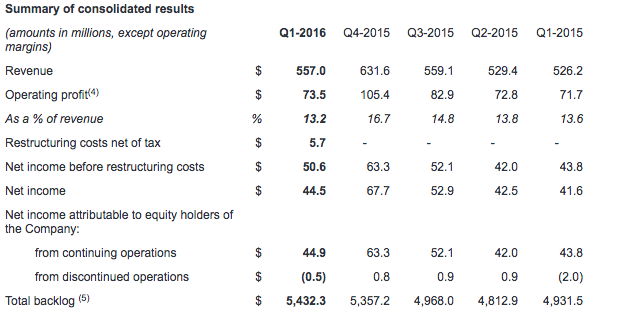
Q1 revenue of $557.0 million vs. $526.2 million in prior year
Q1 EPS from continuing operations of $0.17 ($0.19 before restructuring costs(1)) vs. $0.17 in prior year
Incurred $5.7 million net after-tax restructuring costs for process improvement
Quarterly dividend increase by half a cent to 7.5 cents per share effective September 30, 2015
Mining divestiture concluded subsequent to end of quarter
CAE today reported revenue of $557.0 million for the first quarter of fiscal year 2016, representing a 6% increase from the first quarter last year. First quarter net income attributable to equity holders from continuing operations was $44.9 million ($0.17 per share) vs. $43.8 million ($0.17 per share) last year.
Excluding $5.7 million (net after-tax) restructuring costs incurred this quarter related to the transformation of CAE's production processes and product offering currently underway, net income before restructuring costs(2) was $50.6 million ($0.19 per share), up 16% from the same period last year. All financial information is in Canadian dollars.
"We're off to a solid start to the fiscal year with a good first quarter performance and a new process improvement program underway to further strengthen our competitive position," said Marc Parent, CAE's President and Chief Executive Officer. "In Civil we had a higher margin on higher utilization(3) of our training network and we had a double-digit increase in operating income over last year. We also had higher operating income in Defence, with robust order activity supporting our outlook for growth. We maintained our strong financial position, and I am pleased to announce that CAE's Board of Directors has approved a half cent increase to CAE's quarterly dividend, which becomes 7.5 cents per share, effective September 30, 2015. This marks our fifth increase in as many years and underscores our confidence in the business."
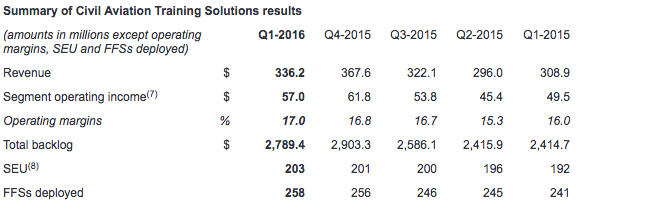
Civil Aviation Training Solutions (Civil)
First quarter Civil revenue was $336.2 million, up 9% compared to the same quarter last year. First quarter operating income was $57.0 million (17.0% of revenue), up 15% compared to the first quarter last year. Training centre utilization was 73% for the quarter.
During the quarter Civil signed training solutions agreements with customers including Southwest Airlines to re-equip its entire full-flight simulator (FFS) fleet with CAE TroposTM 6000XR visual systems and it sold eight FFSs to airlines worldwide involving a range of Airbus, Boeing and Bombardier aircraft types. Civil extended its Multi-crew Pilot License (MPL) First Officer Program with Japan Airlines for cadet training, and also signed and renewed long term agreements with airlines including easyJet, EVA Air and Air China for First Officer and Commercial Pilot License training. In total, Civil received $288.3 million in orders this quarter for a book-to-sales(6) ratio of 0.86x. The ratio for the last 12 months was 1.09x. First quarter Civil backlog was $2.8 billion, including CAE's share of joint ventures.
Defence and Security (Defence)
Revenue for Defence in the first quarter was $196.9 million, stable compared to the first quarter last year. First quarter operating income was $23.6 million (12.0% of revenue), up 8% compared to $21.9 million (11.1% of revenue) last year.
During the quarter, Defence signed notable contracts involving enduring platforms and integrated training systems. They include a comprehensive solution to train all future U.S. Army fixed-wing pilots, a contract from Boeing to build P-8A Poseidon operational flight trainers for the U.S. Navy, and a contract from Airbus Defence and Space for UH-72A Lakota flight training devices for the U.S. Army. As part of the U.S. foreign military sale program, Defence was also awarded a contract by the U.S. Navy for MH-60R Seahawk helicopter trainers for the Royal Australian Navy. In total, Defence received $207.3 million in orders this quarter, representing a book-to-sales ratio of 1.05x. The ratio for the last 12 months was 0.95x. First quarter Defence backlog was $2.6 billion, including CAE's share of joint ventures and unfunded backlog.
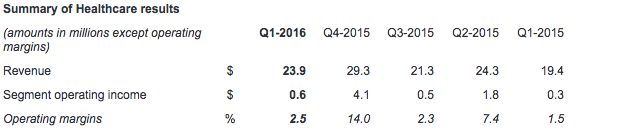
Healthcare
Revenue for Healthcare was $23.9 million in the first quarter, up 23% compared to the same quarter last year. First quarter operating income was $0.6 million (2.5% of revenue), compared to $0.3 million last year (1.5% of revenue).
During the quarter, Healthcare sold patient, ultrasound and surgical simulators, as well as its simulation centre management solutions and courseware to a range of healthcare education and defence customers in the U.S., Eurasia and the Middle East. Healthcare also continued to innovate its product offering with the release of a tablet-operated, facilitator-driven software called CAE VivoTM, which enables facilitators to have full remote control over CAE's patient simulators' physiology and responses.
Additional financial highlights
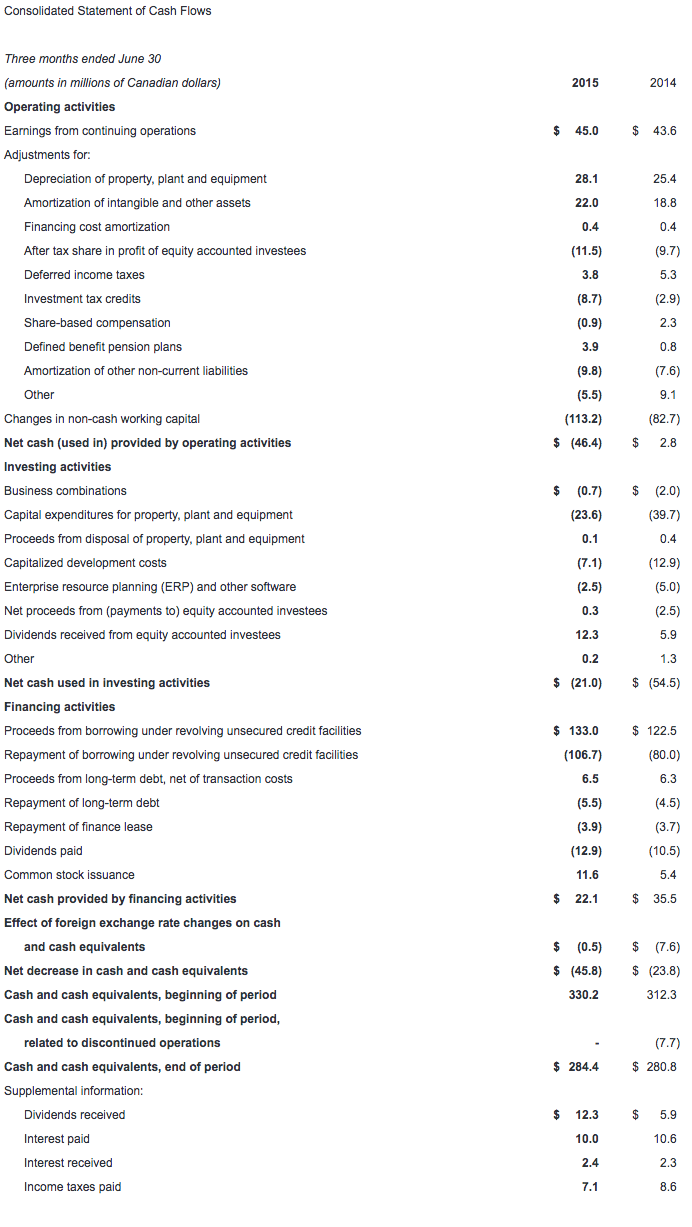
Free cash flow(9) from continuing operations was negative $61.2 million in the first quarter compared to negative $20.9 million in the first quarter last year. The decrease was mainly attributable to a higher investment in non-cash working capital(10) and lower cash from continuing operating activities. Net cash used in continuing operating activities and net cash used in investing activities was $67.4 million, compared to $51.7 million in the prior year.
Income taxes this quarter were $9.8 million, representing an effective tax rate of 18% compared to 21% in the first quarter last year. The lower rate this year was mainly attributable to a change in the mix of income from various jurisdictions.
Growth and maintenance capital expenditures(11) totaled $23.6 million for the quarter compared to $39.7 million in the first quarter last year.
Net debt(12) ended at $1,006.8 million this quarter, compared to $949.6 million last quarter. CAE's net debt-to-total capital(13) ratio was at 36.6%.
CAE will pay a dividend of 7.5 cents per share effective September 30, 2015 to shareholders of record at the close of business on September 15, 2015.
Subsequent events
Subsequent to the end of the first quarter, CAE concluded the sale of its mining business, known as Datamine, to Constellation Software. CAE Mining's financial results have been reported as part of CAE's discontinued operations in its consolidated financial statements for the past year.
Management outlook for fiscal 2016
The Company's outlook for growth and operating margins remains consistent with that given at the end of the last fiscal year. CAE continues to expect growth in fiscal 2016 across all business segments, with a stronger second half of the fiscal year. In Civil, the Company expects annual operating margins to improve from the 16.3% level reached last year on higher training utilization, and to have FFS unit sales in the range of the fiscal 2015 number. In Defence, it expects modest growth with operating margins in the 12-13% range. CAE continues to anticipate higher returns on capital employed(14) going forward as it fills training centre capacity, undertakes a greater share of its customers' training activities, and incrementally invests in accretive, customer-driven growth opportunities.
Strengthening competitive position
To further enhance its competitive position, CAE began to implement this quarter a process improvement plan to transform its production processes and product offering. The Company anticipates an additional approximate $19 million (after-tax) expenditure, consisting primarily of severance and other related costs to bring the transformation to fruition. The transformation is expected to be substantially completed by the first half of fiscal 2017, and with all new processes in place, it is expected to result in approximately $15 million to $20 million of annualized cost savings thereafter, depending on product mix.
"By leveraging our new technologies, including the CAE 7000XR Series full-flight simulator, we have launched a new program this quarter to transform and streamline our processes and product offering for the future. With it, CAE will become even more efficient in the way it engineers, manufactures and delivers its simulators. This will ensure that CAE maintains a strong leadership position in a highly dynamic market and will create an even wider gap between CAE and its competitors," said Marc Parent, President and Chief Executive Officer. "Based on our current volume of business, we expect this to impact approximately a further 350 people out of our worldwide workforce of 8,000 over the next 12 months. We will do everything we can to mitigate the impact on those of our employees and their families who will unfortunately be affected by these changes."
Detailed information
Readers are strongly advised to view a more detailed discussion of our results by segment in the Management's Discussion and Analysis (MD&A) and CAE's consolidated interim financial statements which are posted on our website at www.cae.com/investors.
CAE's consolidated interim financial statements and management's discussion and analysis for the quarter ended June 30, 2015 have been filed with the Canadian Securities Administrators on SEDAR (www.sedar.com) and are available on our website (www.cae.com). They have also been filed with the U.S. Securities and Exchange Commission and are available on their website (www.sec.gov).
Corporate Social Responsibility report
This year, CAE has enhanced its Corporate Social Responsibility reporting and its fiscal 2015 CSR report is now available for download at www.cae.com.
Conference call Q1 FY2016
CAE President and CEO, Marc Parent; Stephane Lefebvre, Vice President, Finance, and CFO; and Andrew Arnovitz, Vice President, Strategy and Investor Relations will conduct an earnings conference call today at 1:30 p.m. ET. The call is intended for analysts, institutional investors and the media. Participants can listen to the conference by dialling + 1 877 586 3392 or +1 416 981 9024. The conference call will also be audio webcast live for the public at www.cae.com. CAE is also holding its FY2015 Annual and Special Meeting of Shareholders at 11 a.m. E.T. today at the Hotel Sofitel in Montreal. The meeting will be webcast live on CAE's site at www.cae.com.
CAE is a global leader in the delivery of training for the civil aviation, defence and security, and healthcare markets. We design and integrate the industry's most comprehensive training solutions, anchored by the knowledge and expertise of our 8,000 employees, our world-leading simulation technologies and a track record of service and technology innovation spanning nearly seven decades. Our global presence is the broadest in the industry, with 160 sites and training locations in 35 countries, including our joint venture operations, and the world's largest installed base of flight simulators. Each year, we train more than 120,000 civil and defence crewmembers, as well as thousands of healthcare professionals worldwide.
Caution concerning limitations of summary earnings press release
This summary earnings press release contains limited information meant to assist the reader in assessing CAE's performance but it is not a suitable source of information for readers who are unfamiliar with CAE and is not in any way a substitute for the Company's financial statements, notes to the financial statements, and MD&A reports.
Caution concerning forward-looking statements
Certain statements made in this news release are forward-looking statements. These statements include, without limitation, statements relating to our fiscal 2016 financial guidance (including revenues, capital investment and margins) and other statements that are not historical facts. Forward-looking statements are typically identified by future or conditional verbs such as anticipate, believe, expect, and may. All such forward-looking statements are made pursuant to the 'safe harbour' provisions of applicable Canadian securities laws and of the United States Private Securities Litigation Reform Act of 1995. Forward-looking statements, by their very nature, are subject to inherent risks and uncertainties and are based on several assumptions, both general and specific, which give rise to the possibility that actual results or events could differ materially from our expectations expressed in or implied by such forward-looking statements and that our business outlook, objectives, plans and strategic priorities may not be achieved. As a result, we cannot guarantee that any forward-looking statement will materialize and we caution you against relying on any of these forward-looking statements. The forward-looking statements contained in this news release describe our expectations as of August 12, 2015 and, accordingly, are subject to change after such date. Except as may be required by Canadian securities laws, we do not undertake any obligation to update or revise any forward-looking statements contained in this news release, whether as a result of new information, future events or otherwise. Except as otherwise indicated by CAE, forward-looking statements do not reflect the potential impact of any special items or of any dispositions, monetizations, mergers, acquisitions, other business combinations or other transactions that may occur after August 12, 2015. The financial impact of these transactions and special items can be complex and depends on the facts particular to each of them. We therefore cannot describe the expected impact in a meaningful way or in the same way we present known risks affecting our business. Forward-looking statements are presented in this news release for the purpose of assisting investors and others in understanding certain key elements of our expected fiscal 2016 financial results and in obtaining a better understanding of our anticipated operating environment. Readers are cautioned that such information may not be appropriate for other purposes. The value of capital investments expected to be made by CAE in FY2016 assumes that capital investments will be made in accordance with our current annual plan. However, there can be no assurance that such investment levels will be maintained with the result that the value of actual capital investments made by CAE during such period could materially differ from current expectations.
Material assumptions
A number of economic, market, operational and financial assumptions were made by CAE in preparing its forward-looking statements for fiscal 2016 contained in this news release, including, but not limited to certain economic and market assumptions including: modest economic growth and interest rates to remain largely unchanged in fiscal 2016; a sustained level of competition in civil, defence & healthcare markets; no material financial, operational or competitive consequences of changes in regulations affecting our business; and a relatively stable defence market.
Assumptions concerning our businesses
A number of assumptions concerning CAE's business were also made in the preparation of its forward-looking statements for fiscal 2016 contained in this news release, including, but not limited to factors including: productivity and efficiency gains to lower CAE's manufacturing costs and cycle times; maintenance of CAE's market share in civil simulator sales in the face of price competition from recent market entrants; higher Civil training network utilization; and lower total capital expenditure requirements.
The foregoing assumptions, although considered reasonable by CAE on August 12, 2015, may prove to be inaccurate. Accordingly, our actual results could differ materially from our expectations as set forth in this news release.
Material risks
Important risk factors that could cause our assumptions and estimates to be inaccurate and actual results or events to differ materially from those expressed in or implied by our forward-looking statements, including our fiscal 2016 financial guidance, are set out in CAE's 2015 Annual MD&A (included in the CAE 2015 Annual Report) filed by CAE with the Canadian Securities Administrators (available at sedar.com) and with the U.S. Securities and Exchange Commission (available at sec.gov). These documents are also available at cae.com. The realization of our forward-looking statements, including our ability to meet our fiscal 2016 outlook, essentially depends on our business performance which, in turn, is subject to many risks. Accordingly, readers are cautioned that any of the disclosed risks could have a material adverse effect on our forward-looking statements. We caution that the disclosed list of risk factors is not exhaustive and other factors could also adversely affect our results.
Non-GAAP and other financial measures
This press release includes non-GAAP and other financial measures. Non-GAAP measures are useful supplemental information but may not have a standardized meaning according to GAAP. These measures should not be confused with, or used as an alternative for, performance measures calculated according to GAAP. They should also not be used to compare with similar measures from other companies. Management believes that providing certain non-GAAP measures provides users with a better understanding of our results and trends and provides additional information on our financial and operating performance.
(1) Earnings per share before restructuring costs is a non-GAAP measure calculated by excluding the effect of restructuring costs from the diluted earnings per share from continuing operations attributable to equity holders of the Company. The restructuring impact per share is obtained by dividing restructuring costs, net of taxes, by the average number of diluted shares. We track it because we believe it provides a better indication of our operating performance and makes it easier to compare across reporting periods.
(2) Net income before restructuring costs is a non-GAAP measure we use as an alternate view of our operating results. We calculate it by taking our net income attributable to equity holders of the Company from continuing operations and adding back restructuring costs, net of tax. We track it because we believe it provides a better indication of our operating performance and makes it easier to compare across reporting periods.
(3) Utilization rate is an operating measure we use to assess the performance of our simulator training network. We calculate it by taking the number of training hours sold on our simulators during the period divided by the practical training capacity available for the same period.
(4) Operating profit is non-GAAP measure that shows us how we have performed before the effects of certain financing decisions, tax structures and discontinued operations. We track it because we believe it makes it easier to compare our performance with previous periods, and with companies and industries that do not have the same capital structure or tax laws.
(5) Total backlog is non-GAAP measure that includes obligated backlog, joint venture backlog and unfunded backlog. Obligated backlog represents the expected value of orders we have received but have not yet executed. Joint venture backlog is obligated backlog that represents the expected value of our share of orders that our joint ventures have received but have not yet executed. Unfunded backlog represents firm Defence and Security orders we have received but have not yet executed for which funding authorization has not yet been obtained. We include unexercised negotiated options which we view as having a high probability of being exercised, but exclude indefinite-delivery/indefinite-quantity (IDIQ) contracts.
(6) The book-to-sales ratio is the total orders divided by total revenue in the period.
(7) Segment operating income (SOI) is a non-GAAP measure and our key indicator of each segment's financial performance. This measure gives us a good indication of the profitability of each segment because it does not include the impact of any items not specifically related to the segment's performance. We calculate it by using segment operating profit, including the after tax share in profit of equity accounted investees and excluding net finance expense, income taxes, restructuring costs and other items not specifically related to the segment's performance.
(8) Simulator equivalent unit (SEU) is an operating measure we use to show the total average number of FFSs available to generate earnings during the period.
(9) Free cash flow is a non-GAAP measure that shows us how much cash we have available to invest in growth opportunities, repay debt and meet ongoing financial obligations. We use it as an indicator of our financial strength and liquidity. We calculate it by taking the net cash generated by our continuing operating activities, subtracting maintenance capital expenditures, investment in other assets not related to growth and dividends paid and adding proceeds from the disposal of property, plant and equipment, dividends received from equity accounted investees and proceeds, net of payments, from equity accounted investees.
(10) Non-cash working capital is a non-GAAP measure we use to monitor how much money we have committed in the day-to-day operation of our business. We calculate it by taking current assets (not including cash and cash equivalents and assets held for sale) and subtracting current liabilities (not including the current portion of long-term debt and liabilities related to assets held for sale).
(11) Maintenance capital expenditure is a non-GAAP measure we use to calculate the investment needed to sustain the current level of economic activity. Growth capital expenditure is a non-GAAP measure we use to calculate the investment needed to increase the current level of economic activity.
(12) Net debt is a non-GAAP measure we use to monitor how much debt we have after taking into account liquid assets such as cash and cash equivalents. We use it as an indicator of our overall financial position, and calculate it by taking our total long-term debt, including the current portion of long-term debt, and subtracting cash and cash equivalents.
(13) Net debt-to-capital is calculated as net debt divided by the sum of total equity plus net debt.
(14) Return on capital employed (ROCE) is a non-GAAP measure we use to evaluate the profitability of our invested capital. We calculate this ratio over a rolling four-quarter period by taking net income attributable to equity holders of the Company excluding net finance expense, after tax, divided by the average capital employed
For a detailed reconciliation of these measures as well as other non-GAAP and other financial measures monitored by CAE, please refer to CAE's management's discussion and analysis filed with the Canadian Securities Administrators available on our website (www.cae.com) and on SEDAR (www.sedar.com).
Contacts
Investor Relations:
Andrew Arnovitz, Vice President, Strategy and Investor Relations 1-514-734-5760, [email protected]
Media:
Hélène V. Gagnon, Vice President, Public Affairs and Global Communications 1-514-340-5536, [email protected]