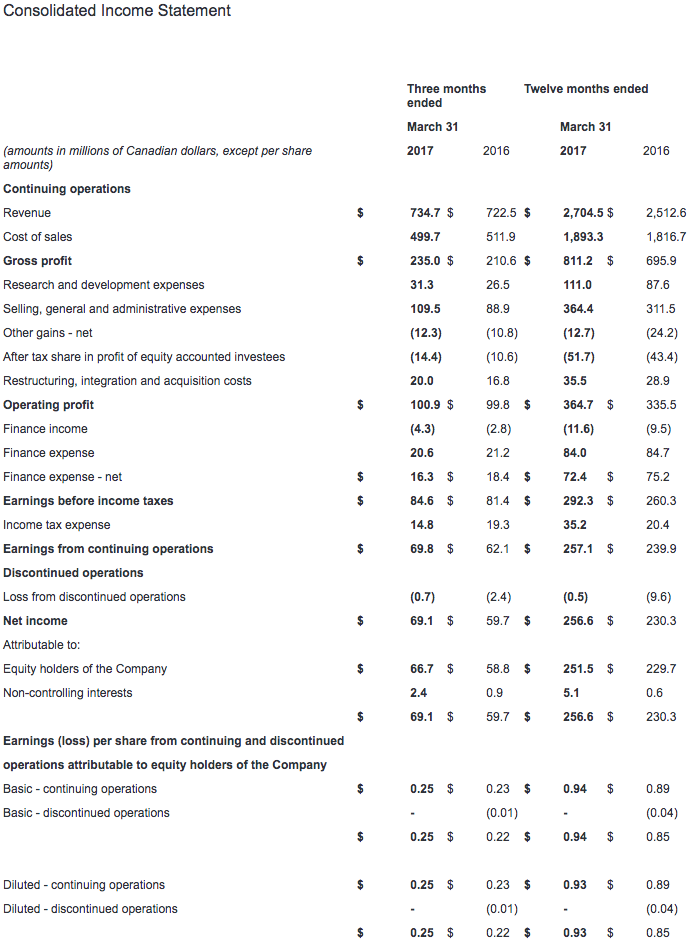
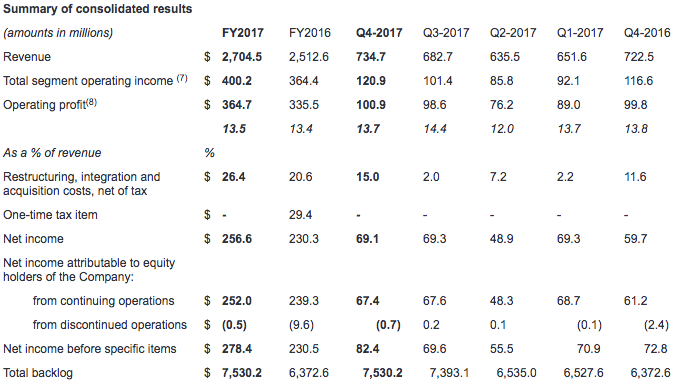
Q4 revenue up 2% to $734.7 million and annual revenue up 8% to $2.7 billion
Q4 and annual EPS from continuing operations of $0.25 and $0.93 ($0.31 and $1.03 before specific items(1), up 15% and 20% respectively, compared to last year)
Record $7.5 billion order backlog(2) up 18% over last year
Annual free cash flow(3) up 32% to $327.9 million for 118% cash conversion(4)
Return on Capital Employed(5) of 11.2% up from 10.6% last year
CAE today reported revenue of $734.7 million for the fourth quarter of fiscal year 2017, representing 2% growth from the fourth quarter last year. Fourth quarter net income attributable to equity holders from continuing operations was $67.4 million ($0.25 per share) compared to $61.2 million ($0.23 per share) last year. Fourth quarter net income before specific items(6) was $82.4 million, or $0.31 per share, representing an EPS increase of 15% over the same period last year.
Annual fiscal 2017 revenue was $2.7 billion, representing 8% growth from the prior year. Annual net income attributable to equity holders from continuing operations was $252.0 million ($0.93 per share). Annual net income before specific items was $278.4 million, or $1.03 per share, representing an EPS increase of 20% over last year. All financial information is in Canadian dollars.
"CAE achieved strong results overall in fiscal year 2017 and I am pleased with our progress to pursue our vision to be the recognized global training partner of choice," said Marc Parent, CAE's President and Chief Executive Officer. "We grew earnings per share by 20% this year, generated 32% higher free cash flow, and we bolstered the recurring nature of our business with a record $7.5 billion order backlog. In Civil, we grew segment operating income by 15%, on higher utilization of our training centres, and we sold 50 full-flight simulators. In Defence, we won orders and contract options worth a combined $2.3 billion, contributing to a record $4.2 billion Defence backlog. As we look to the year ahead, we expect continued good growth, and we take confidence in the strength of our competitive position, high degree of recurring business, and supportive market fundamentals."
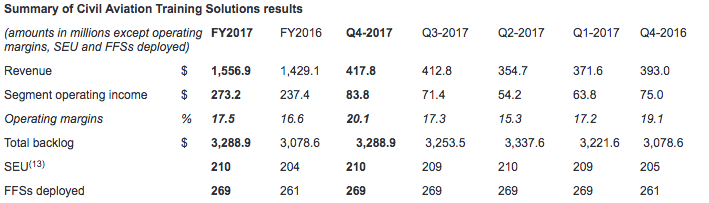
Civil Aviation Training Solutions (Civil)
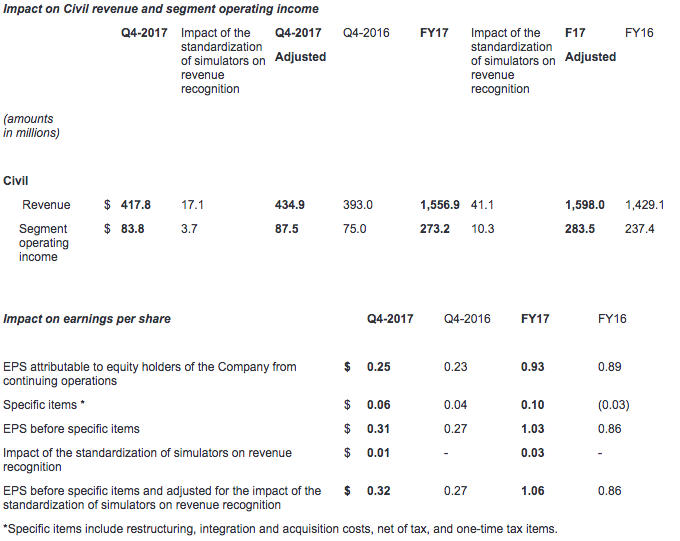
Fourth quarter Civil revenue was $417.8 million, up 6% compared to the same quarter last year, and segment operating income was $83.8 million (20.1% of revenue), up 12% compared to the fourth quarter last year. The fourth quarter includes the impact of a change in revenue recognition arising from the standardization of certain types of commercial aircraft simulators. Civil revenue and segment operating income, if adjusted (9)(10) for the impact of this change would have been $434.9 million and $87.5 million, respectively. Fourth quarter Civil training centre utilization(11) was 77%.
Annual Civil revenue was $1,556.9 million, up 9% compared to last year, and segment operating income was $273.2 million (17.5% of revenue), up 15% over the prior year. Annual Civil revenue and segment operating income, if adjusted for the impact of the change in revenue recognition (as described above) would have been $1,598.0 million and $283.5 million, respectively. Annual Civil training centre utilization was 76%.
During the quarter, Civil signed training solutions contracts valued at $481.3 million, including agreements for pilot training services in Europe and the Middle East, and the sale of 17 full-flight simulators (FFSs) to customers including Shanghai Eastern Flight Training, Donghai Airlines, Korean Air, Ethiopian Airlines and Airbus. Demonstrating CAE's progress with its training strategy, Civil booked a record $1.70 billion in orders during the year, including 50 FFS sales and comprehensive, long-term training agreements with airlines including Vietnam Airlines and Jet Airways. In business aviation, Civil won long-term training contracts with customers worldwide, including two large aircraft services and charter companies based in Europe.
The Civil book-to-sales(12) ratio was 1.15x for the quarter and 1.09x for the last 12 months. The Civil backlog at the end of the year was $3.3 billion, which is up 7% from the prior year period.
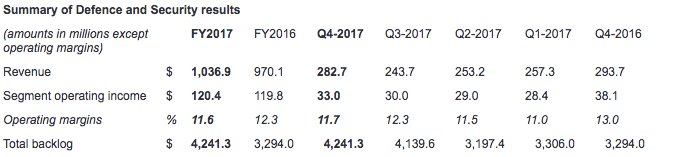
Defence and Security (Defence)
Fourth quarter Defence revenue was $282.7 million, down 4% compared to the same quarter last year and segment operating income was $33.0 million (11.7% of revenue), compared to $38.1 million (13.0% of revenue) in the fourth quarter last year. Annual Defence revenue was $1,036.9 million, up 7% over last year, and annual segment operating income was $120.4 million (11.6% of revenue), up 1% over the prior year period. As reported last year, fourth quarter fiscal year 2016 segment operating income included non-recurring items, before which, Defence segment operating income growth this year would have been approximately 4.5%.
During the quarter, Defence booked orders for $238.8 million and received another $233.0 million in contract options. Notable wins include a training systems integration contract from Airbus for a comprehensive C295W aircrew and maintenance training solution for the Royal Canadian Air Force's Fixed-Wing Search and Rescue program. This program has an expected value, including options, of more than $300 million over 26 years. Defence was also awarded a contract to provide comprehensive training services for the NATO E-3A Airborne Warning and Control System aircrew training program. It also received an order to continue providing a range of training support services for the U.S. Air Force C-130J Maintenance and Aircrew Training System program.
For the year, Defence booked a record $1.4 billion in orders and received another $939.2 million in contract options, highlighting its position as a global Training Systems Integrator. The Defence book-to-sales ratio was 0.84x for the quarter and 1.33x for the last 12 months (excluding contract options). The Defence backlog, including options and CAE's interest in joint ventures, at the end of the year reached a record $4.2 billion, which is up 29% from the prior year period.
Healthcare
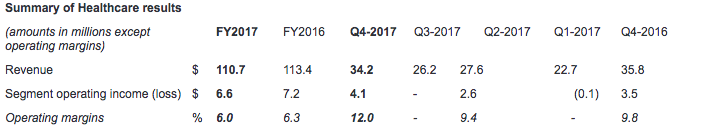
Fourth quarter Healthcare revenue was $34.2 million compared to $35.8 million in the same quarter last year, and fourth quarter segment operating income was $4.1 million (12.0% of revenue) compared to $3.5 million (9.8% of revenue) in the fourth quarter last year. Annual Healthcare revenue was $110.7 million compared to $113.4 million last year, and annual segment operating income was $6.6 million (6.0% of revenue) compared to $7.2 million (6.3% of revenue) last year.
CAE Healthcare further established its position as the innovation leader in simulation-based healthcare education and training. CAE Healthcare and the Northern Alberta Institute of Technology (NAIT) entered a simulation research partnership to advance healthcare and patient safety. Designated as a CAE Healthcare Centre of Excellence, NAIT will offer a real-world test lab for interdisciplinary, simulation-based education. Also during the year, Healthcare released important updates and new pathologies for existing patient and ultrasound simulators. And recently, CAE Healthcare became the first company to bring a commercial Microsoft HoloLens mixed reality application to the medical simulation market. The CAE VimedixAR ultrasound simulator represents a technological breakthrough with its integration of real-time interactive holograms of the human anatomy.
Additional financial highlights
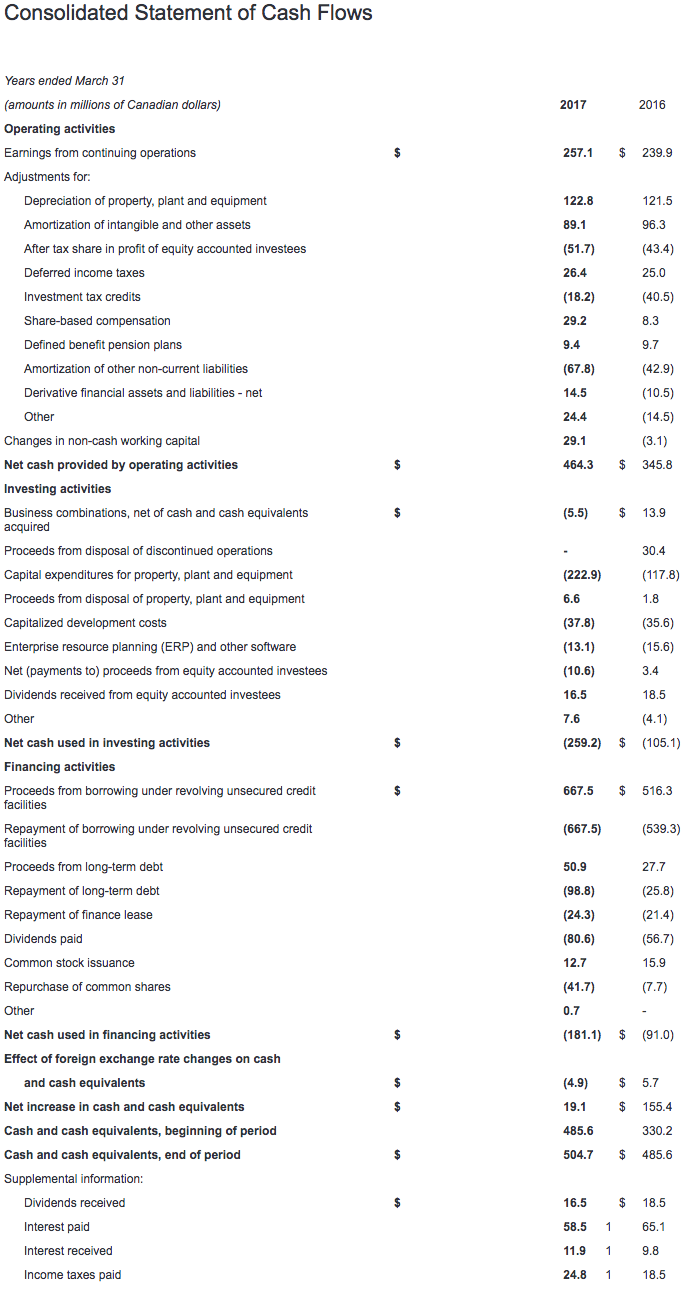
Free cash flow from continuing operations was $160.4 million for the quarter compared to $12.8 million in the fourth quarter last year. Free cash flow for the year was up 32% to $327.9 million, compared to $247.7 million in the same period last year, representing a cash conversion ratio of 118%. The higher free cash flow results mainly from a lower investment in non-cash working capital and an increase in cash provided by continuing operating activities.
Income taxes this quarter were $14.8 million, representing an effective tax rate of 17%, compared to 14% for the last quarter and 24% for the fourth quarter last year. The tax rate this quarter was lower than the fourth quarter of last year due to a change in the mix of income from various jurisdictions and an audit settlement in Canada. Excluding the effect of the settlement, the income tax rate this quarter would have been 22%.
Growth and maintenance capital expenditures(14) totaled $73.6 million this quarter and $222.9 million for the year.
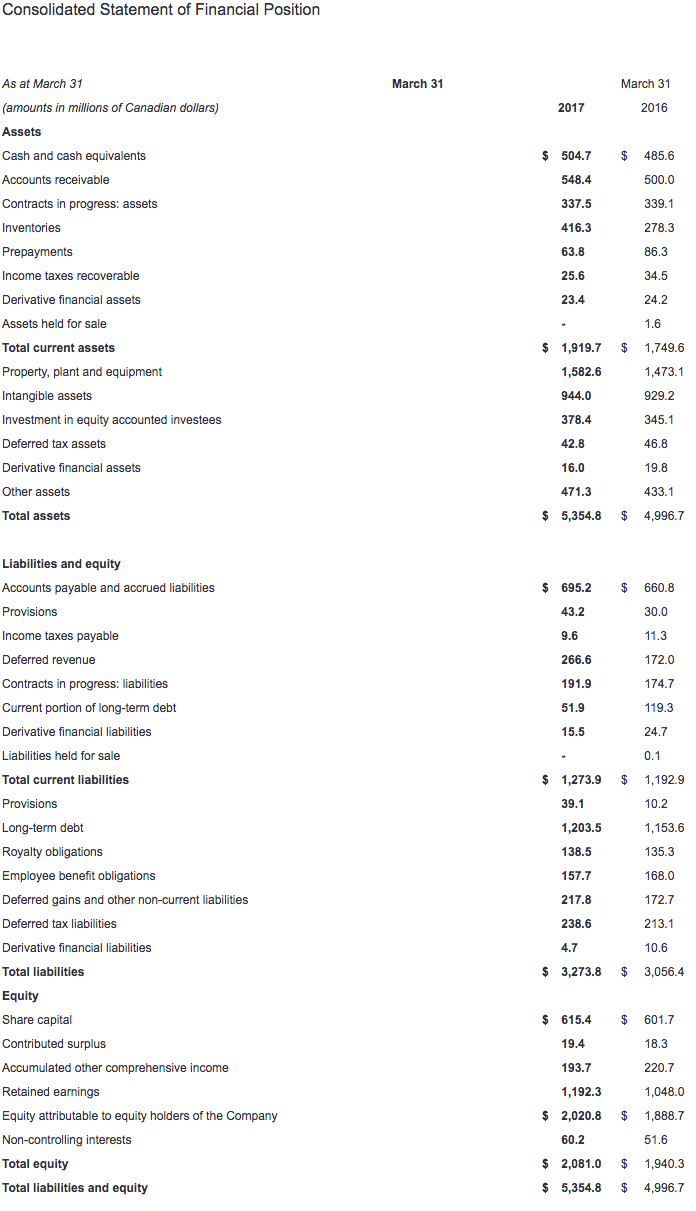
Net debt(15) at the end of the year was $750.7 million for a net debt-to-total capital ratio(16) of 26.5%. This compares to net debt of $787.3 million and a net debt-to-total capital ratio of 28.9% at the end of the last year.
Return on capital employed(5) was 11.2% compared to 10.6% last year.
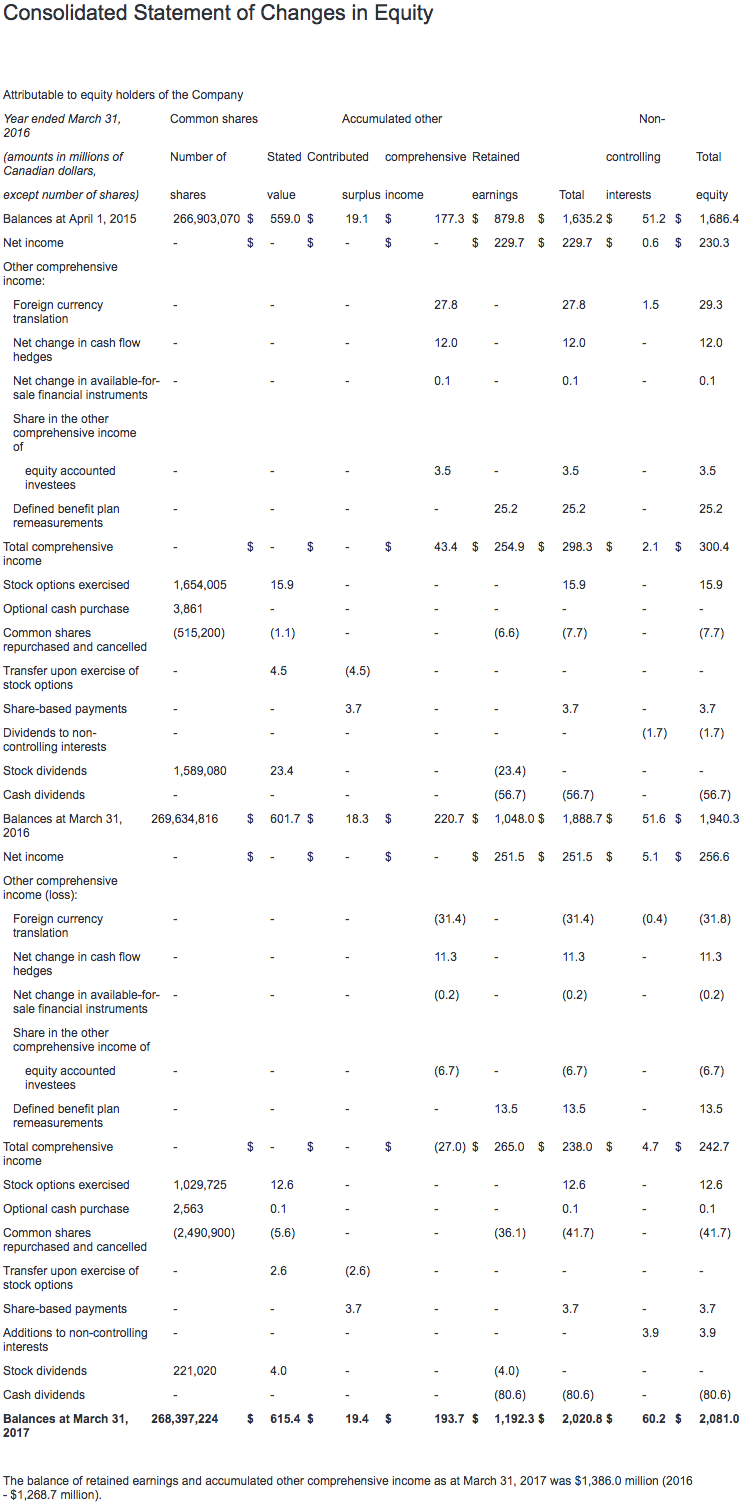
CAE will pay a dividend of 8 cents per share effective June 30, 2017 to shareholders of record at the close of business on June 15, 2017. During fiscal year 2017, CAE paid $80.6 million in dividends to shareholders, compared to $56.7 million in the prior year.
During the three months ended March 31, 2017, CAE repurchased and cancelled a total of 158,600 common shares under the Normal Course Issuer Bid (NCIB), at a weighted average price of $18.97 per common share, for a total consideration of $3.0 million. For the year, CAE repurchased and cancelled a total of 2,490,900 common shares at a weighted average price of $16.73 per common share, for a total consideration of $41.7 million.
Specific items this quarter of $15.0 million (net after-tax) mainly involve the remaining restructuring, integration and acquisition costs related to the purchase of Lockheed Martin Commercial Flight Training (LMCFT).
Management outlook for fiscal 2018
CAE expects continued good growth in fiscal year 2018. In Civil, the Company expects to generate low-double digit percentage segment operating income growth as it makes more progress to penetrate the training market with its innovative solutions and maintains its leadership position in FFS sales. In Defence, the Company expects mid to high single-digit percentage growth as it begins to ramp up recently won programs from a record backlog and continues to win its fair share of opportunities in a stronger defence market. CAE expects Healthcare to resume growth this year, with increased sales coming from its opportunities pipeline and the launch of new products, which it expects to put it on course for long-term, double-digit growth. The Company expects lower capital intensity in fiscal 2018, with total capital expenditures expected to be in the range of $150 million (vs. $222.9 million in fiscal 2017), commensurate with market-led opportunities for accretive investment returns. Management's expectations are based on the prevailing positive market conditions and customer receptivity to CAE's training solutions as well as material assumptions contained in this press release, quarterly MD&A and in CAE's fiscal year 2017 MD&A.
Impact of the standardization of certain types of simulators on revenue recognition
CAE's process improvement program results in the standardization of certain types of commercial aircraft simulators. For standardized simulators, percentage-of-completion (POC) accounting is no longer appropriate and thus the Company began recognizing revenue upon completion for such simulators in fiscal 2017. To facilitate performance comparability, management has provided the impact of this change on Civil revenue (Civil revenue - adjusted(9)), Civil segment operating income (Civil segment operating income - adjusted (10)), and EPS (EPS before specific items and adjusted for the impact of the standardization of simulators on revenue recognition(17)).
These are non-GAAP measures. We calculate the impact of the change in revenue recognition arising from the standardization of certain types of simulators by adjusting for the recognition of Civil revenue, Civil segment operating income and EPS upon completion for these simulators versus the Civil revenue, Civil segment operating income and EPS that would have otherwise been recognized under POC accounting.
Detailed information
Readers are strongly advised to view a more detailed discussion of our results by segment in the Management's Discussion and Analysis (MD&A) and CAE's consolidated interim financial statements which are posted on our website at www.cae.com/investors.
CAE's consolidated financial statements and MD&A for the year ended March 31, 2017 have been filed with the Canadian Securities Administrators on SEDAR (www.sedar.com) and are available on our website (www.cae.com). They have also been filed with the U.S. Securities and Exchange Commission and are available on their website (www.sec.gov).
Conference call Q4 FY2017
CAE President and CEO, Marc Parent; Sonya Branco, Vice President, Finance, and CFO; and Andrew Arnovitz, Vice President, Strategy and Investor Relations will conduct an earnings conference call today at 1:00 p.m. ET. The call is intended for analysts, institutional investors and the media. Participants can listen to the conference by dialling + 1 877 586 3392 or +1 416 981 9024. The conference call will also be audio webcast live for the public at www.cae.com.
CAE is a global leader in training for the civil aviation, defence and security, and healthcare markets. Backed by a 70-year record of industry firsts, we continue to help define global training standards with our innovative virtual-to-live training solutions to make flying safer, maintain defence force readiness and enhance patient safety. We have the broadest global presence in the industry, with over 8,500 employees, 160 sites and training locations in over 35 countries. Each year, we train more than 120,000 civil and defence crewmembers and thousands of healthcare professionals worldwide.
Caution concerning limitations of summary earnings press release
This summary earnings press release contains limited information meant to assist the reader in assessing CAE's performance but it is not a suitable source of information for readers who are unfamiliar with CAE and is not in any way a substitute for the Company's financial statements, notes to the financial statements, and MD&A reports.
Caution concerning forward-looking statements
Certain statements made in this press release are forward-looking statements. These statements include, without limitation, statements relating to our fiscal 2017 financial guidance (including revenues, capital investment and margins) and other statements that are not historical facts. Forward-looking statements are typically identified by future or conditional verbs such as anticipate, believe, expect, and may. All such forward-looking statements are made pursuant to the 'safe harbour' provisions of applicable Canadian securities laws and of the United States Private Securities Litigation Reform Act of 1995. Forward-looking statements, by their very nature, are subject to inherent risks and uncertainties and are based on several assumptions, both general and specific, which give rise to the possibility that actual results or events could differ materially from our expectations expressed in or implied by such forward-looking statements and that our business outlook, objectives, plans and strategic priorities may not be achieved. As a result, we cannot guarantee that any forward-looking statement will materialize and we caution you against relying on any of these forward-looking statements. The forward-looking statements contained in this press release describe our expectations as of May 31, 2017 and, accordingly, are subject to change after such date. Except as may be required by Canadian securities laws, we do not undertake any obligation to update or revise any forward-looking statements contained in this news release, whether as a result of new information, future events or otherwise. Except as otherwise indicated by CAE, forward-looking statements do not reflect the potential impact of any special items or of any dispositions, monetizations, mergers, acquisitions, other business combinations or other transactions that may occur after May 31, 2017. The financial impact of these transactions and special items can be complex and depends on the facts particular to each of them. We therefore cannot describe the expected impact in a meaningful way or in the same way we present known risks affecting our business. Forward-looking statements are presented in this press release for the purpose of assisting investors and others in understanding certain key elements of our expected fiscal 2018 financial results and in obtaining a better understanding of our anticipated operating environment. Readers are cautioned that such information may not be appropriate for other purposes. The value of capital investments expected to be made by CAE in FY2018 assumes that capital investments will be made in accordance with our current annual plan. However, there can be no assurance that such investment levels will be maintained with the result that the value of actual capital investments made by CAE during such period could materially differ from current expectations.
Material assumptions
A number of economic, market, operational and financial assumptions were made by CAE in preparing its forward-looking statements for fiscal 2018 contained in this news release, including, but not limited to certain economic and market assumptions including: modest economic growth and interest rates to remain largely unchanged in fiscal 2018; a sustained level of competition in civil, defence & healthcare markets; no material financial, operational or competitive consequences of changes in regulations affecting our business; and a more positive defence market.
Assumptions concerning our businesses
A number of assumptions concerning CAE's business were also made in the preparation of its forward-looking statements for fiscal 2018 contained in this news release, including, but not limited to factors including: productivity and efficiency gains to lower CAE's manufacturing costs and cycle times; maintenance of CAE's market share in civil simulator sales in the face of price competition; and higher Civil training network utilization.
The foregoing assumptions, although considered reasonable by CAE on May 31, 2017, may prove to be inaccurate. Accordingly, our actual results could differ materially from our expectations as set forth in this news release.
Material risks
Important risk factors that could cause our assumptions and estimates to be inaccurate and actual results or events to differ materially from those expressed in or implied by our forward-looking statements, including our fiscal 2018 financial guidance, are set out in CAE's MD&A for the year ended March 31, 2017 filed by CAE with the Canadian Securities Administrators (available at www.sedar.com) and with the U.S. Securities and Exchange Commission (available at www.sec.gov). The fiscal year 2017 MD&A is also available at www.cae.com. The realization of our forward-looking statements, including our ability to meet our fiscal 2018 outlook, essentially depends on our business performance which, in turn, is subject to many risks. Accordingly, readers are cautioned that any of the disclosed risks could have a material adverse effect on our forward-looking statements. We caution that the disclosed list of risk factors is not exhaustive and other factors could also adversely affect our results.
Non-GAAP and other financial measures
This press release includes non-GAAP and other financial measures. Non-GAAP measures are useful supplemental information but may not have a standardized meaning according to GAAP. These measures should not be confused with, or used as an alternative for, performance measures calculated according to GAAP. They should also not be used to compare with similar measures from other companies. Management believes that providing certain non-GAAP measures provides users with a better understanding of our results and trends and provides additional information on our financial and operating performance.
(1) Earnings per share before specific items is a non-GAAP measure calculated by excluding the effect of restructuring, integration and acquisition costs and one-time tax items from the diluted earnings per share from continuing operations attributable to equity holders of the Company. The effect per share is obtained by dividing the restructuring, integration and acquisition costs, net of tax, and one-time tax items by the average number of diluted shares. We track it because we believe it provides a better indication of our operating performance on a per share basis and makes it easier to compare across reporting periods.
(2) Total backlog is a non-GAAP measure that includes obligated backlog, joint venture backlog and unfunded backlog. Obligated backlog represents the expected value of orders we have received but have not yet executed. Joint venture backlog is obligated backlog that represents the expected value of our share of orders that our joint ventures have received but have not yet executed. Unfunded backlog represents firm Defence and Security orders we have received but have not yet executed and for which funding authorization has not yet been obtained. We include unexercised negotiated options which we view as having a high probability of being exercised, but exclude indefinite-delivery/indefinite-quantity (IDIQ) contracts.
(3) Free cash flow is a non-GAAP measure that shows us how much cash we have available to invest in growth opportunities, repay debt and meet ongoing financial obligations. We use it as an indicator of our financial strength and liquidity. We calculate it by taking the net cash generated by our continuing operating activities, subtracting maintenance capital expenditures, investment in other assets not related to growth and dividends paid and adding proceeds from the disposal of property, plant and equipment, dividends received from equity accounted investees and proceeds, net of payments, from equity accounted investees.
(4) Cash conversion rate is a non-GAAP financial measure we use to assess our performance in cash flow generation and as a basis for evaluating our capitalization structure. We calculate it by dividing free cash flow by net income before specific items.
(5) Return on capital employed (ROCE) is a non-GAAP measure we use to evaluate the profitability of our invested capital. We calculate this ratio over a rolling four-quarter period by taking net income attributable to equity holders of the Company excluding net finance expense, after tax, divided by the average capital employed.
(6) Net income before specific items is a non-GAAP measure we use as an alternate view of our operating results. We calculate it by taking our net income attributable to equity holders of the Company from continuing operations and adding back restructuring, integration and acquisition costs, net of tax, and one-time tax items. We track it because we believe it provides a better indication of our operating performance and makes it easier to compare across reporting periods.
(7) Total segment operating income is a non-GAAP measure and is the sum of our key indicator of each segment's financial performance. Segment operating income gives us an indication of the profitability of each segment because it does not include the impact of any items not specifically related to the segment's performance. We calculate total segment operating income by taking the operating profit and excluding the impact of restructuring, integration and acquisition costs.
(8) Operating profit is an additional GAAP measure that shows us how we have performed before the effects of certain financing decisions, tax structures and discontinued operations. We track it because we believe it makes it easier to compare our performance with previous periods, and with companies and industries that do not have the same capital structure or tax laws.
(9) Civil revenue - adjusted is a non-GAAP measure we present to facilitate performance comparability that takes into account the impact of the change in revenue recognition arising from the standardization of certain types of simulators. We calculate this by taking our Civil revenue and adjusting for the impact of the recognition of revenue upon completion for these simulators versus the revenue that would have otherwise been recognized under POC accounting.
(10) Civil segment operating income - adjusted is a non-GAAP measure we present to facilitate performance comparability that takes into account the impact of the change in revenue recognition arising from the standardization of certain types of simulators. We calculate this by taking our Civil segment operating income and adjusting for the impact of the recognition of segment operating income upon completion for these simulators versus the segment operating income that would have otherwise been recognized under POC accounting.
(11) Utilization rate is an operating measure we use to assess the performance of our Civil simulator training network. We calculate it by taking the number of training hours sold on our simulators during the period divided by the practical training capacity available for the same period.
(12) The book-to-sales ratio is the total orders divided by total revenue in a given period.
(13) Simulator equivalent unit (SEU) is an operating measure we use to show the total average number of FFSs available to generate earnings during the period.
(14) Maintenance capital expenditure is a non-GAAP measure we use to calculate the investment needed to sustain the current level of economic activity. Growth capital expenditure is a non-GAAP measure we use to calculate the investment needed to increase the current level of economic activity.
(15) Net debt is a non-GAAP measure we use to monitor how much debt we have after taking into account liquid assets such as cash and cash equivalents. We use it as an indicator of our overall financial position, and calculate it by taking our total long-term debt, including the current portion of long-term debt, and subtracting cash and cash equivalents.
(16) Net debt-to-capital is calculated as net debt divided by the sum of total equity plus net debt.
(17) EPS before specific items and adjusted for the impact of the standardization of simulators on revenue recognition is a non-GAAP measure calculated by excluding the effect of restructuring, integration and acquisition costs, one-time tax items and the impact of the standardization of certain types of simulators from the diluted earnings per share from continuing operations attributable to equity holders of the Company. The effect per share is obtained by dividing restructuring, integration and acquisition costs, net of tax, one-time tax items as well as the impact of the recognition of net income upon completion for these simulators versus the net income that would have otherwise been recognized under POC accounting by the average number of diluted shares. We track it because we believe it makes it easier to compare across reporting periods.
For a detailed reconciliation of these measures as well as other non-GAAP and other financial measures monitored by CAE, please refer to CAE's MD&A filed with the Canadian Securities Administrators available on our website (www.cae.com) and on SEDAR (www.sedar.com).